What has been will be again, what has been done will be done again;
there is nothing new under the sun. ~ Ecclesiastes 1:9
The concept that there is a time and a turn for everything is a cornerstone concept for Cycles, Investing, and Trading.
The repetition of history is essentially the DNA of Cycles. For Investors, this concept manifests as investment selection, since allocating a larger portion of one’s portfolio to sectors that will perform better in the future is what creates portfolio alpha. For Traders, this concept manifests as Bullish vs. Bearish phases or oscillations. Today let’s focus on the Bullish vs. Bearish oscillations, as it is one of the best tool to make money in the markets.
Technical Analysis: The Bull vs. Bear Ball Game
Imagine that the stock market is a ball game between the Bulls and the Bears, and each team gets possession of the ball to score. Of course, when one team has possession of the ball, the opposing team plays defense. There are three questions here: 1) who has possession of the ball, 2) do they score points when they have possession and 3) when does the other team take possession of the ball?
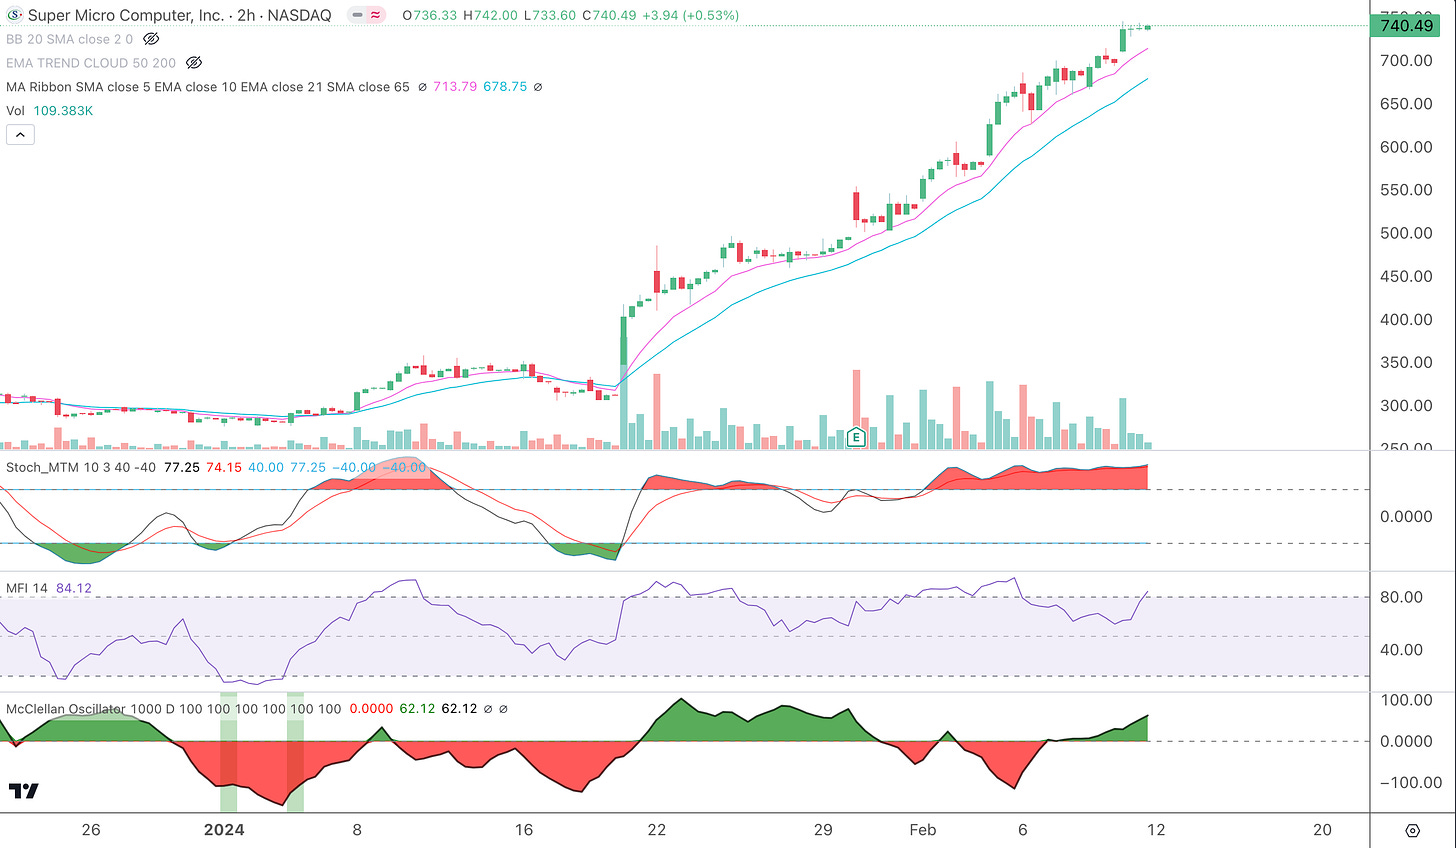
The Stochastic Momentum indicator is a great way to see who has possession of an Investment. When the indicator crosses up above the -40 mark, the Bulls take possession of the ball. When the indicator crosses below the 40 mark, the Bears take possession of the ball.
The Money Flow Indicator (MFI) serves as both a confirming indicator of strength and an early warning of when possession can change. The direction and slope of the MFI confirms the Stochastics Momentum indicator, while the oversold or overbought parameters warn of possible possession changes.
The McClellan Breadth Oscillator serves as an indicator of possession, strength, and an early warning of when possession can change for the greater stock market. The Bulls have possession when the McClellan Oscillator is above 0 and the Bears have possession when the indicator is below 0. Strength can be gauged by the slope of the indicator. Finally, an indication of early possession change occurs when the indicator is at a high or low extreme and reverses direction.
The Bears had possession of the market since the beginning of January as the McClellan Oscillator was below zero (refer to the chart above). However, they could not do much with their possession of the ball because the S&P 500 is a market-cap-weighted index and a few tech stocks kept it afloat. The McClellan Oscillator is now above 0 and looks ready to make another bull run. Looking at the SPY ETF as an investment, the Bears had possession for a few days in early January, but the Bulls recaptured possession on 1/11 as the Stochastic Momentum indicator had a bullish crossover. The Money Flow Indicator was up-sloping since 1/17 and this confirmed the bullish strength. The MFI is in the overbought area now and warns of a possible change of possession to the Bears soon, however, this could just be a pullback to the moving averages or a consolidation. Since the Bulls had possession, they did score well as the SPY increased about 6% as it trended above the 10 and 21 Exponential Moving Averages. With breadth increasing again, a new broadening rally may be starting.
Look left on the chart above and notice the different Bullish and Bearish phases and how the Stochastic Momentum, Money Flow Indicator, and McClellan Oscillator served as excellent guides to understanding the next move of the SPY.
Additionally, the S&P 500 Bullish Percent Index breadth indicator just turned bullish once again as it is above its 10-day Simple Moving Average, as the RSI and MACD indicators show early signs of a new bullish trend. It was below the 10 SMA since early January telling us that breadth was in a negative trend. During this Bearish phase, however, the Bears did nothing and now it’s the Bull’s turn once again.
Intermarket Analysis
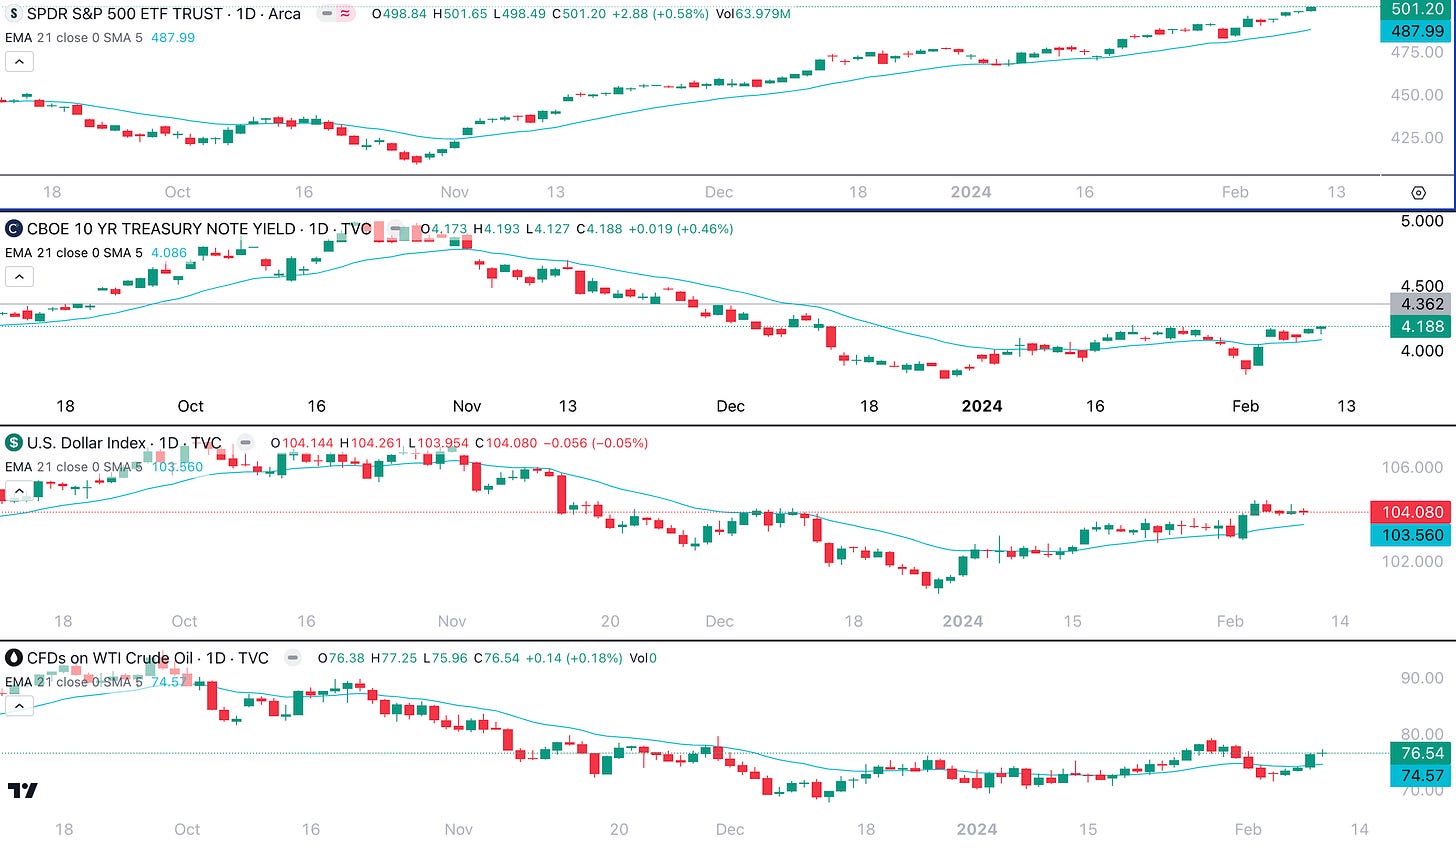
Despite the stock market indexes breaking to new highs, the Intermarket picture is not so supportive. The 10-year Treasury rate (TNX), US Dollar (DXY),they and Oil all seem ready to start a new uptrends, which are not supportive of a stock market rally. Typically they all have inverse relationships with the stock market. Let’s see how long these confused relationships can continue.
Sentiment
Smart Money and Dumb Money both jumped back into buying mode after a small pause in January.
Similarly the Fear and Greed Model shows that early January fear petered out really quickly as Greed took over once again.
Setups: 2-Hour Chart
This previously mentioned setup can be employed on a smaller timeframe for better entries. The chart below shows the SPY on a 2-hour chart. Notice how you could use the oversold Stochastic Momentum readings (green fields) to buy the dip. I use these signals to buy the leading stocks (SMCI, NVDA, AMD, etc.).
Swing trading on the 2-hour chart may be optimal vs. trading on the daily chart as tighter stop losses could be employed. Market weakness (drops in the McClellan Oscillator) could provide buying opportunities in the leader stocks. For weaker stocks, bullish crossovers on the Stochastic Momentum indicator could be used to buy dips, given the price holds or retakes the 21 EMA.
SMCI - Notice how SMCI, the top-performing stock of 2024, is following the 10 EMA (pink line) on the 2-hour chart. It has been so strong that the Bulls had control for most of the time since late January. A pullback to the 10 or 21 EMA would be a buying opportunity.
NVDA - Similarly, NVDA is trending higher on the 10 and 21 EMAs on the 2-hour chart. Pullbacks to the moving average could be bought.
META - META has a bit more back and forth and bullish crossovers on the Stochastic Momentum indicator could be used to enter long positions. the MFI is good to confirm buying strength.
Cycles: Lunar New Year Musings
To those who celebrate it — Happy Lunar New Year! It is the Year of the Wood Dragon and for a little fun let’s see if this affects the stock market. According to the Chinese, there are 12 different animals (Rat, Ox, Tiger…etc.) and 5 different elements (Water, Wood, Fire, Earth, Metal). With 60 different combinations, the same animal and element year occurs 60 years in the past. For example, the last Wood Dragon year came in 1964. The chart below shows the S&P 500 from 1960 to 1965. Notice that it shows the years of the Rat, Ox, Tiger, Rabbit, and Dragon.
Compare this with the chart below of the S&P 500 from 2020 to 2025. Notice some strange similarities:
Rat Year - Sharp early drop, followed by recovery for the rest of the year.
Ox Year - Bullish all year.
Tiger Year - Correction
Rabbit Year - Up year.
If this context continues, we may get a strong bullish year with only minor pullbacks in 2024, the year of the Wood Dragon.
Conclusion
Continue to trend-follow the index or the top-stocks until we get a negative expectation breaker. The trend is your friend until it ends, and it ain’t over yet.
For subscribers, we’ll look at 2-Hour chart setups for CRWD, SPOT, TSM and AMD as well as how the stock market behaved during the different Chinese New Years between 1960 -1970 to see what the rest of the decade may have for us. Again, this is for fun and one should adhere to a trend-following and risk-management system to make money in the market.
Disclaimer - All materials, information, and ideas from Cycles Edge are for educational purposes only and should not be considered Financial Advice. This blog may document actions done by the owners/writers of this blog, thus it should be assumed that positions are likely taken. If this is an issue, please discontinue reading. Cycles Edge takes no responsibility for possible losses, as markets can be volatile and unpredictable, leading to constantly changing opinions or forecasts.


