

The Darvas Box Method 2.0
Premium Section: New Defensive Rotation

Darvas Box 2.0: A Quick Modernization
Nicolas Darvas built his box method from ticker tape in the 1950s — no indicators, just price and volume — and turned roughly $36,000 into about $2.25 million in eighteen months, largely while touring internationally as a professional dancer and trading by telegram.
A box forms after a new high holds for at least three days without breaching its top or bottom; the breakout above that box, on a volume surge, is the buy signal, with the stop trailed up to the bottom of each new box. It’s a sound trend-continuation framework, but “volume surge” was never quantified, and the method has no built-in filter for hostile market regimes — both of which matter more in today’s whipsaw-prone tape.
Six adjustments modernize it without changing the core mechanic:
Quantify volume: Require breakout volume above the 20-day average. On Balance Volume (OBV) can be used to visualize volume — it should be trending up through the consolidation itself, signaling accumulation before the breakout even prints.
Trend filter: The Pristine Method works well here. Only take breakouts above both the 20 Simple Moving Average (SMA) and the 200 SMA.
Relative strength: Only take boxes in names already outperforming their sector, restoring the leadership bias Darvas traded implicitly.
Momentum: The TTM Squeeze confirms momentum and can catch the volatility-compression-to-expansion transition. Timed as price clears the box, a squeeze firing concurrent with the breakout is a strong continuation tell.
Expansion/contraction: Bollinger Bands (based of 20 SMA) can also be used to spot periods of expansion and contraction. A Bollinger Band expansion timed with price breaking a box, after a period of contraction, is a powerful signal.
Timeframe: The daily timeframe remains right for box formation, but the weekly timeframe can be used to confirm the broader stage-2 uptrend first.
Layered together, these filters and indicators cut down the false breakouts that erode the original method’s edge, while keeping its core logic intact. Now let’s use this.
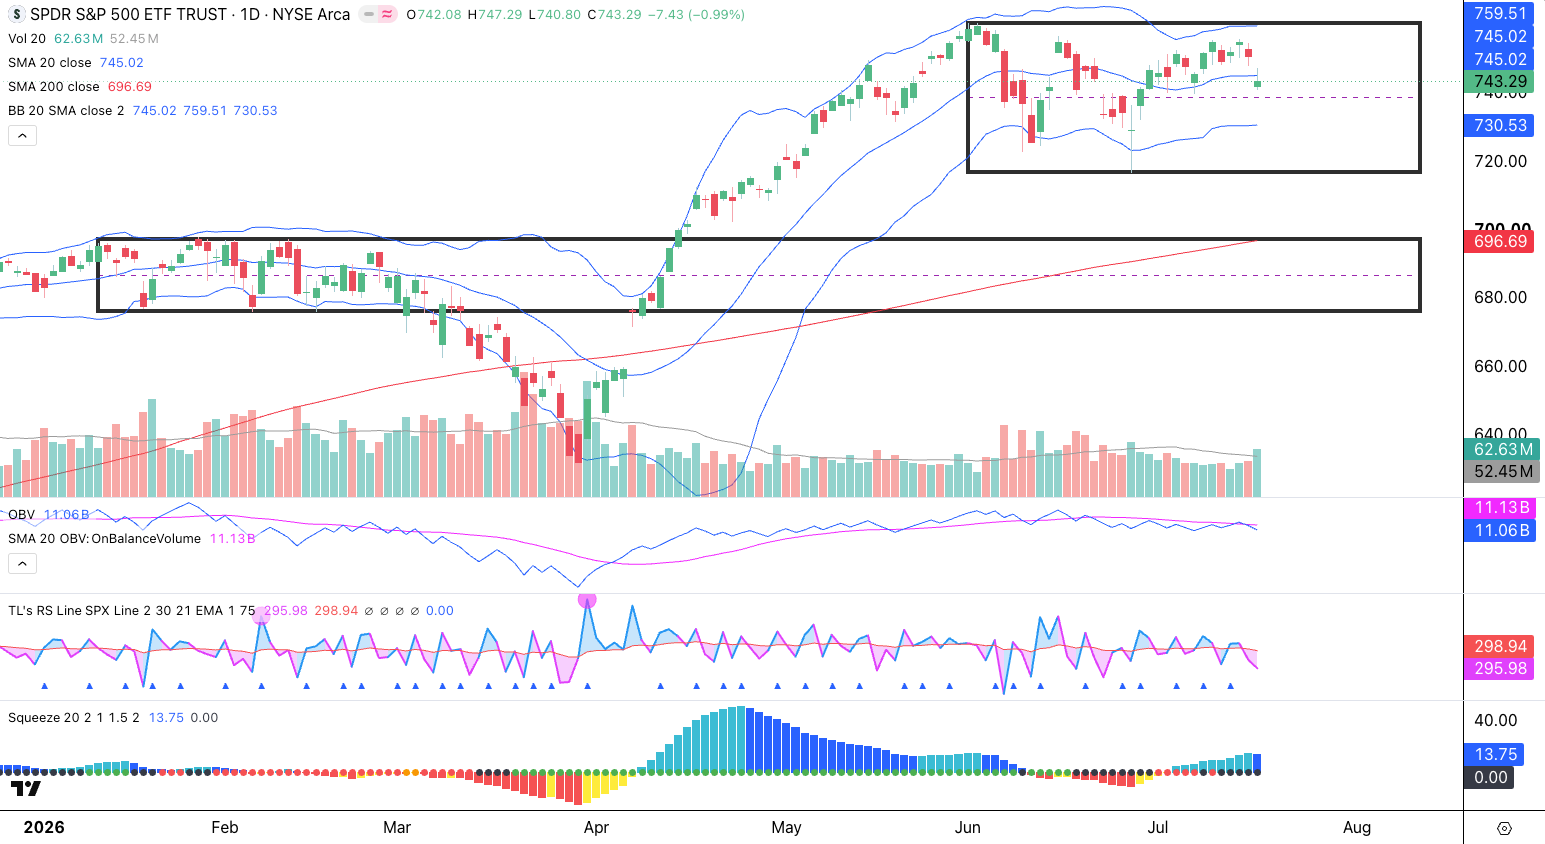
S&P 500 (SPY): The top of the box was formed on June 2nd and the SPY has been in Summer Chop ever since. Within the box, price is deteriorating as it closed below the 20 SMA. Next stop could be the Lower Bollinger Band at $730 or the low of the box at $717. If that breaks, the top of the previous box at $697 (6% lower) can serve as support. Note this also coincides with the 200 SMA. OBV shows volume distribution, as the TTM Squeeze shows waning bullish momentum. Overall, I expect a break down as the Midterm Elections take center stage.
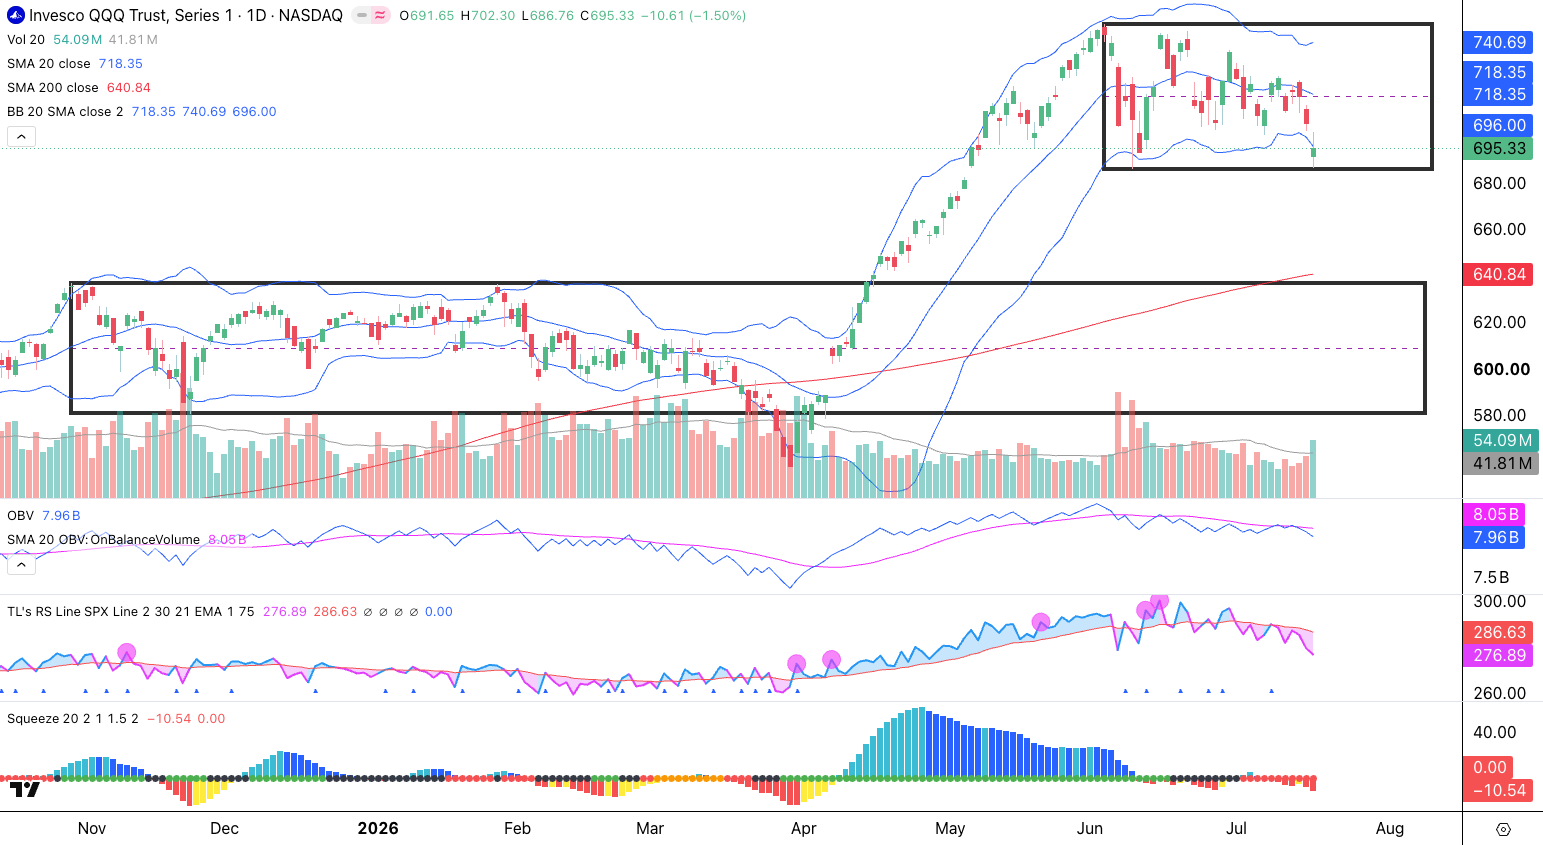
Nasdaq 100 (QQQ): The Nasdaq 100 is a weaker picture as price is already at the lower end of the box. This occurs as the Bollinger Bands appear to start an expansion phase. Volume is above the 20 SMA and the OBV confirms that volume is distributing. The RS Line shows that QQQ has relative weakness vs. the SPY. The TTM Squeeze is confirming increasing bearish momentum. If price breaks the lower box, the top of the previous box could act as support at $637 (8% down). Alternatively the previous box’s lower line at $580 (about 17% down) could also act as support.
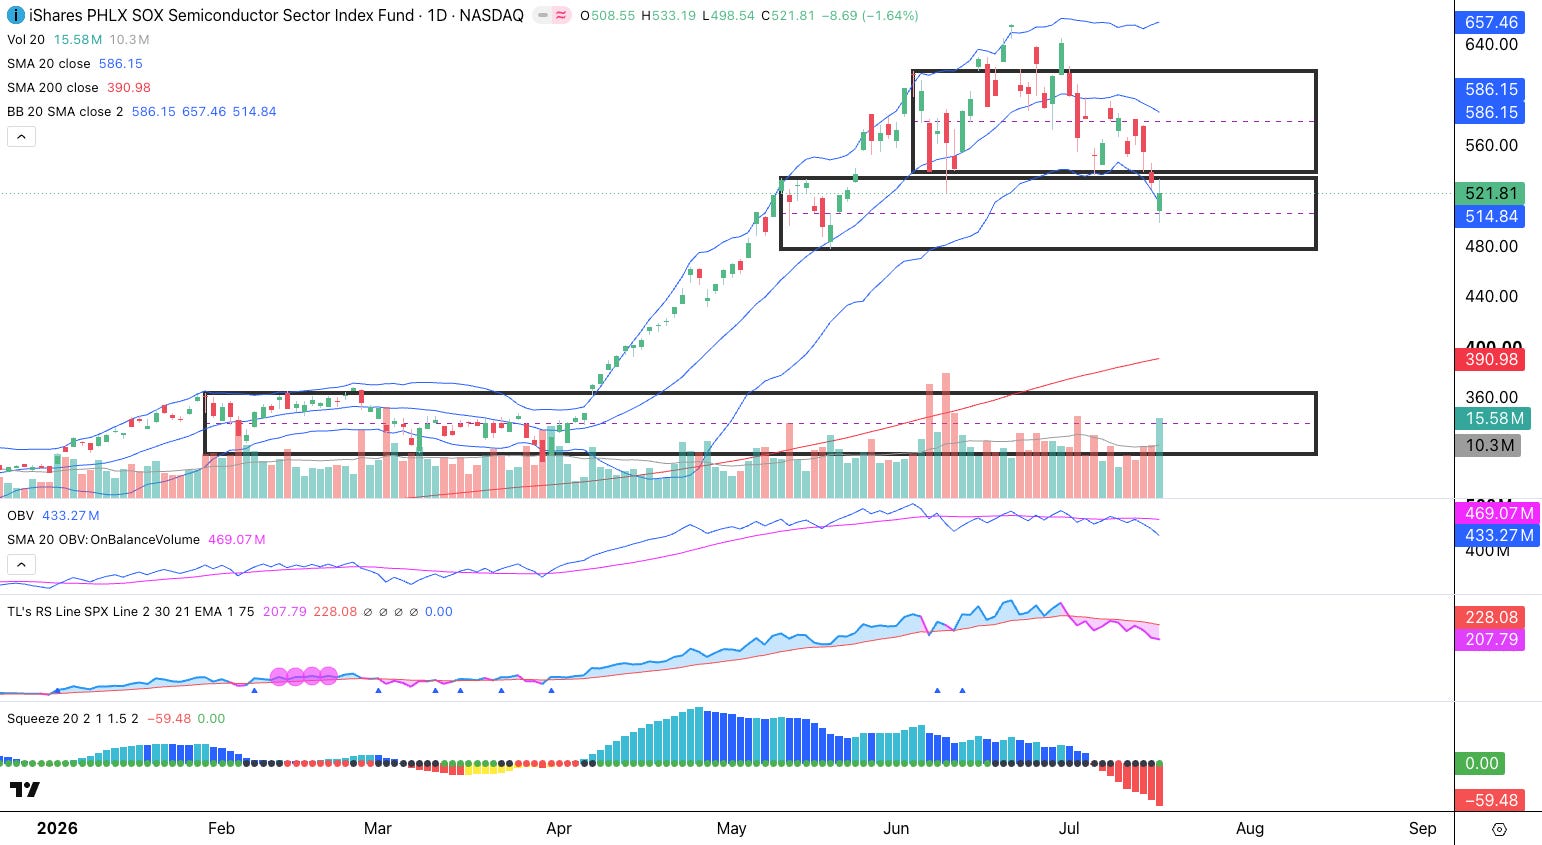
Semiconductors (SOXX): The chart of the SOXX shows why the Darvas Method needs additional indicators. Since early April price was trending above the 20 SMA (or Bollinger Midline in blue). Mid May showed a clean bounce off the 20 SMA. Early June showed a more sloppy bounce off the 20 SMA. During the June 22nd high you can see that OBV made a lower high as the TTM Squeeze showed waning momentum. By the end of June the RS Line showed that the SOXX was beginning to have relative weakness compared to the SPY. We are currently 20% off the highs in a technical bear market. The next support is the current box low at $478 about 8% down. If price goes down to the lower box’s top at $364 it would be an additional 30% drop from Friday’s close.
It’s not all bad as there is a rotation into defensive areas of the market. In the Premium Section we’ll go over possible areas to invest in now using the Darvas Method 2.0.
Disclaimer — All materials, information, and ideas from Cycles Edge are for educational purposes only and should not be considered Financial Advice. This blog may document actions done by the owners/writers of this blog, thus it should be assumed that positions are likely taken. If this is an issue, please discontinue reading. Cycles Edge takes no responsibility for possible losses, as markets can be volatile and unpredictable, leading to constantly changing opinions or forecasts.