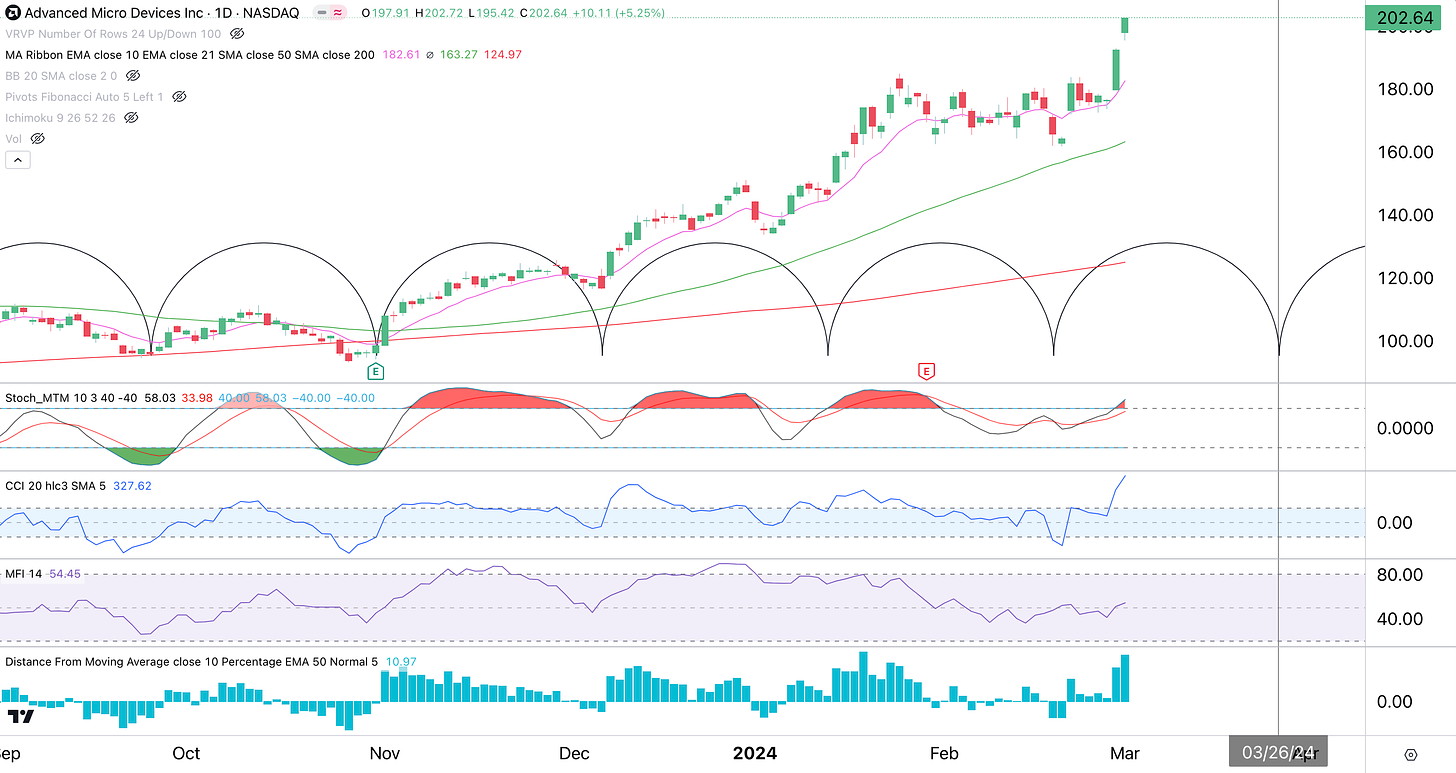
The market continues to trend higher powered by Artificial intelligence and Technology. Advanced Micro Devices is being touted as the “Next Nvidia” as AMD broke out this week to new highs, taking the market with it. You can see from the chart below that AMD is advancing in an orderly fashion, providing a buying opportunity at the cycle bracket trough every 25 trading days (candles). The next significant buying opportunity could come around 3/26.
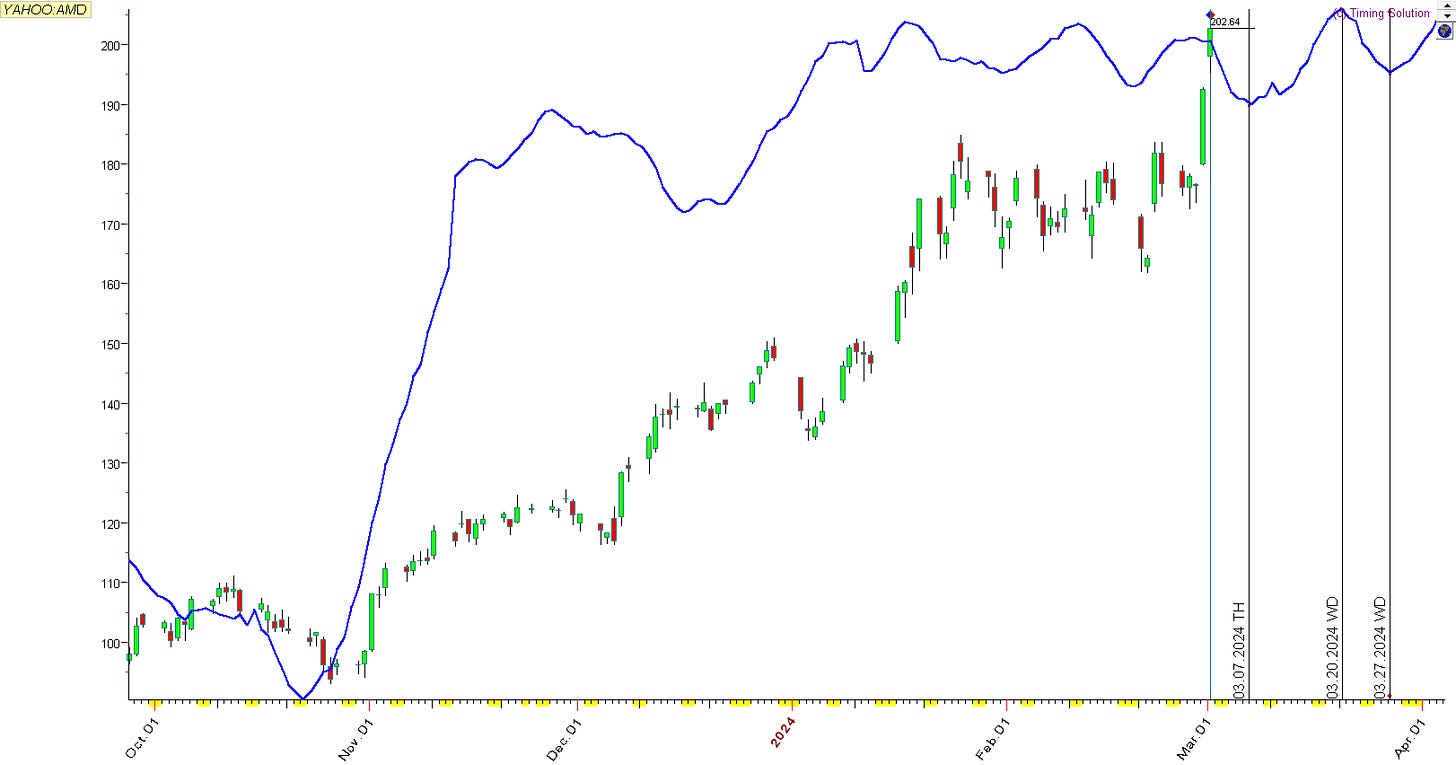
For more active traders, our Cycles Composite shows possible buy points for AMD on 3/7, and 3/27.
The rally is broadening out to other sectors such as Consumer Cyclicals, Real Estate, Basic Materials, Energy, and Industrials. This is a sign that the rally can continue, even during a weak seasonal time.
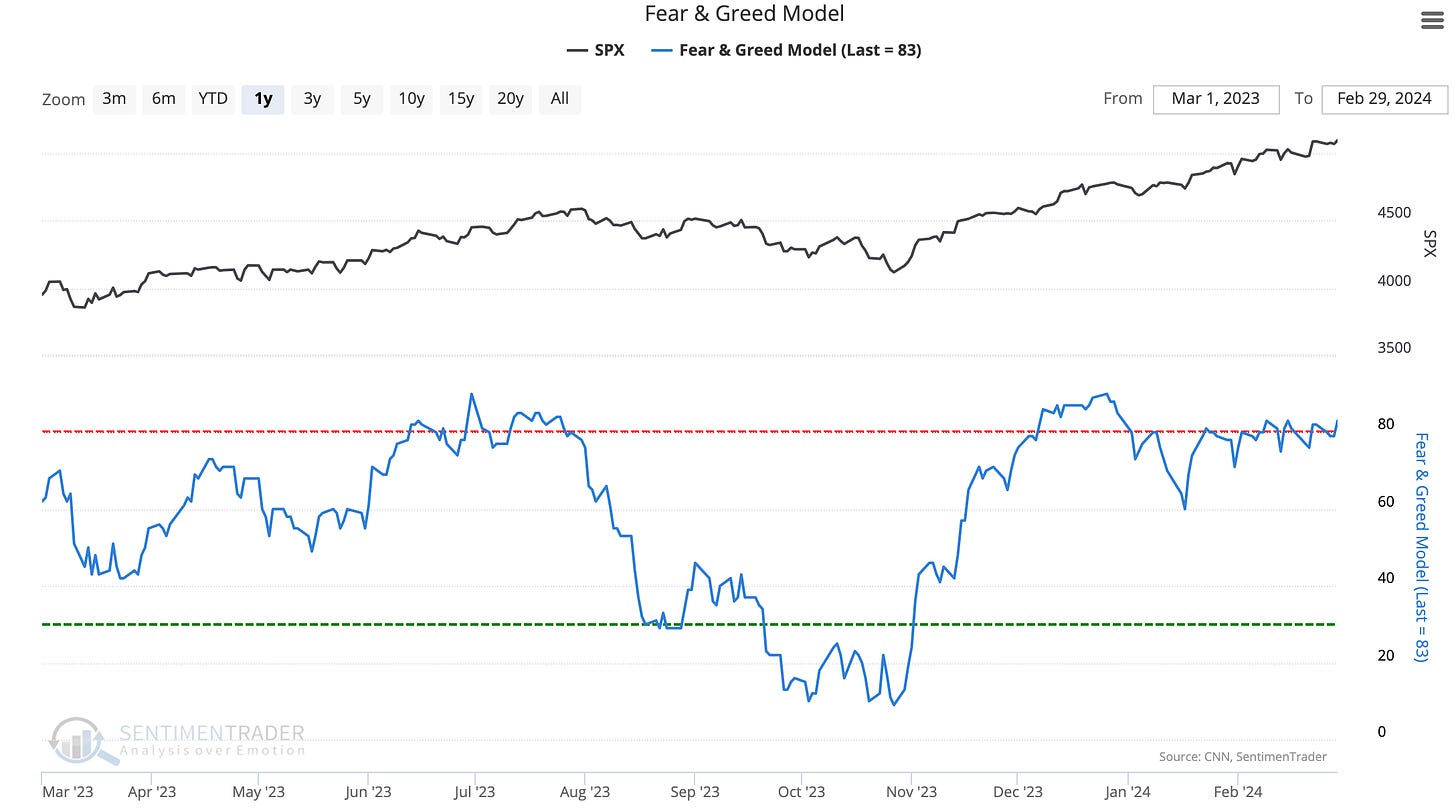
The stock market typically runs into volatility and corrects in February to March. This year the fundamental opportunity of a world-changing new technology (Artificial Intelligence) is making everyone re-imagine a world with the benefits of AI. Growth opportunities, disruption, new efficiencies, and cost-savings are all benefits that the world is contemplating. This fundamental shift is feeding Greed as shown below:
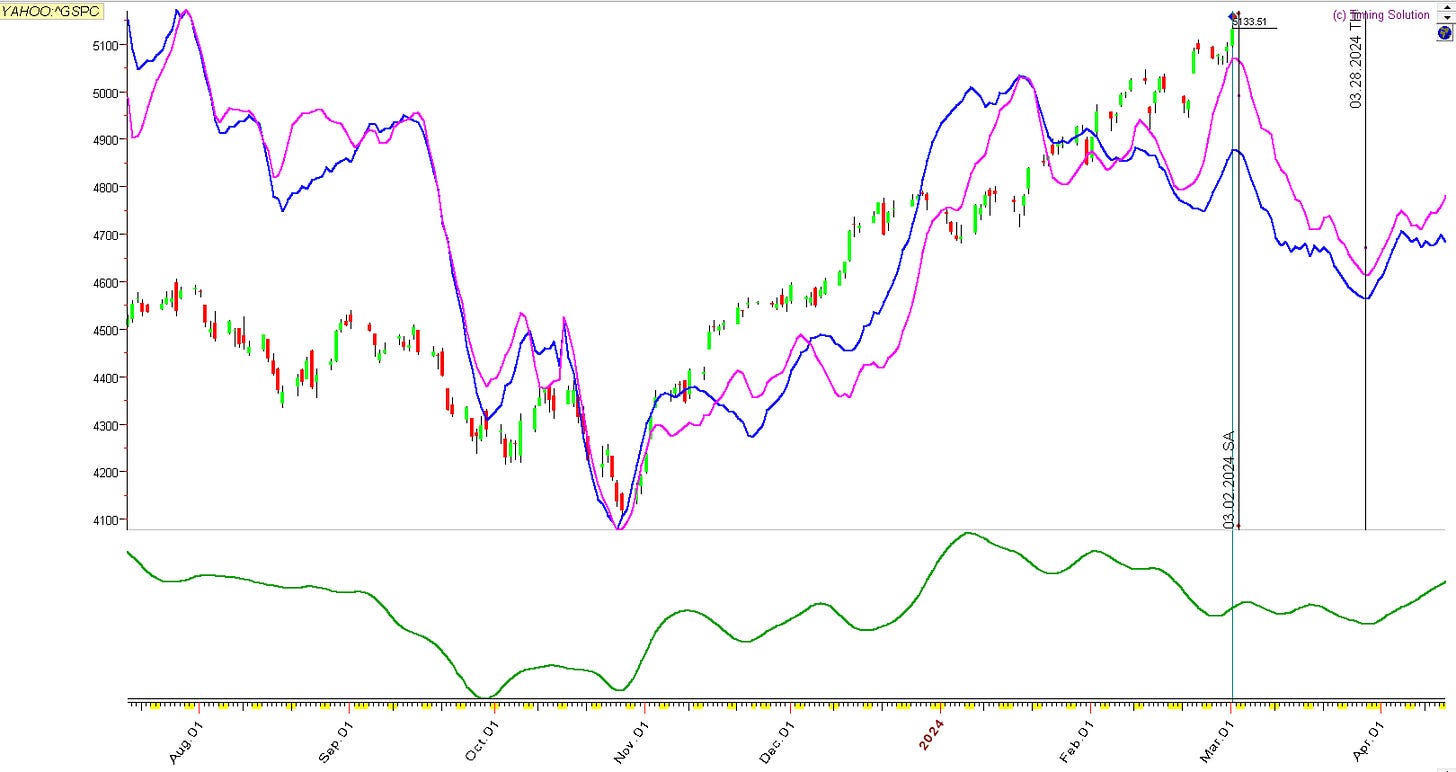
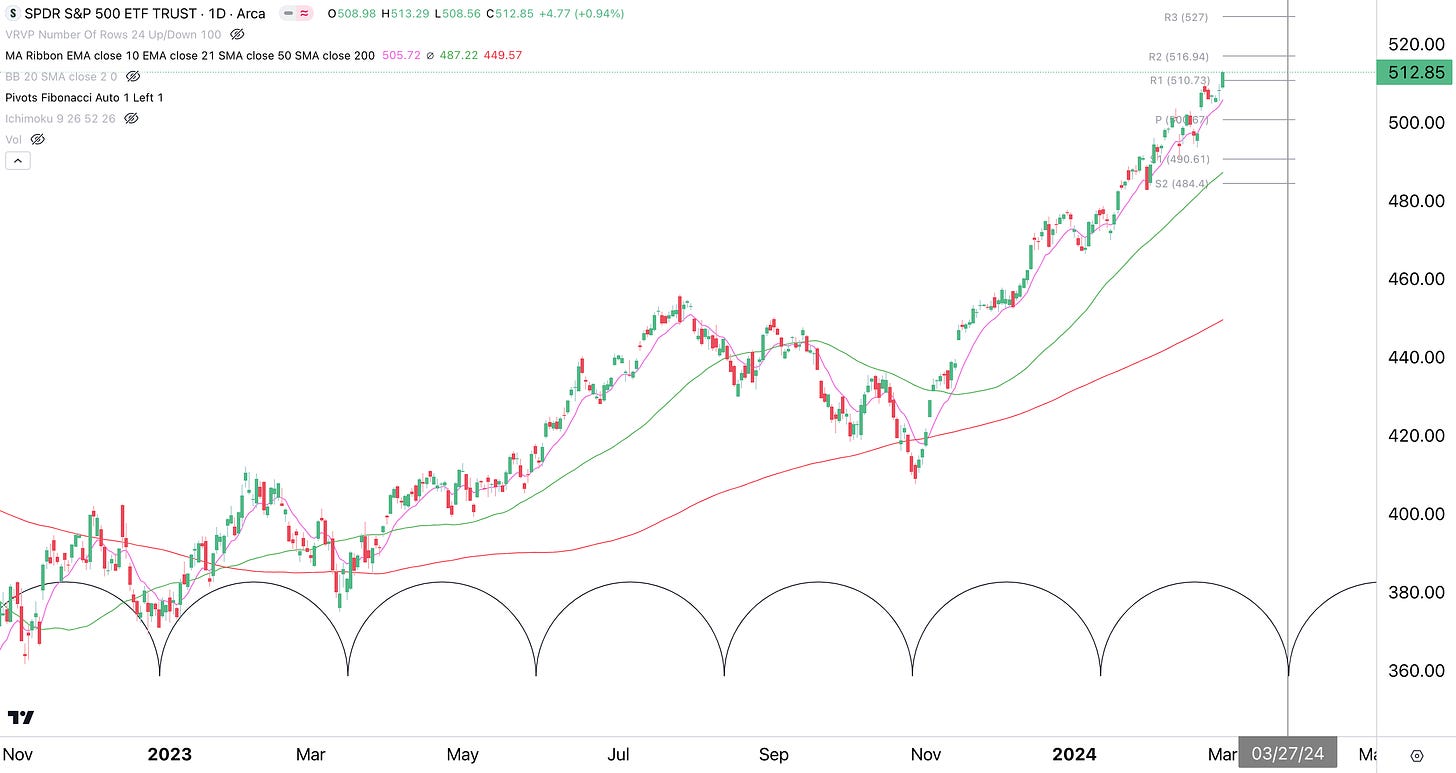
Despite seasonality and cycles pointing down in March, we may continue to trend higher this year on AI enthusiasm. Note that our cycles for the S&P 500 (below) are pointing to a down-cycle in March. With the strength of the market, perhaps a sideways consolidation is all we get. We look to use weakness as buy-the-dip opportunities.
Blow-Off Top?
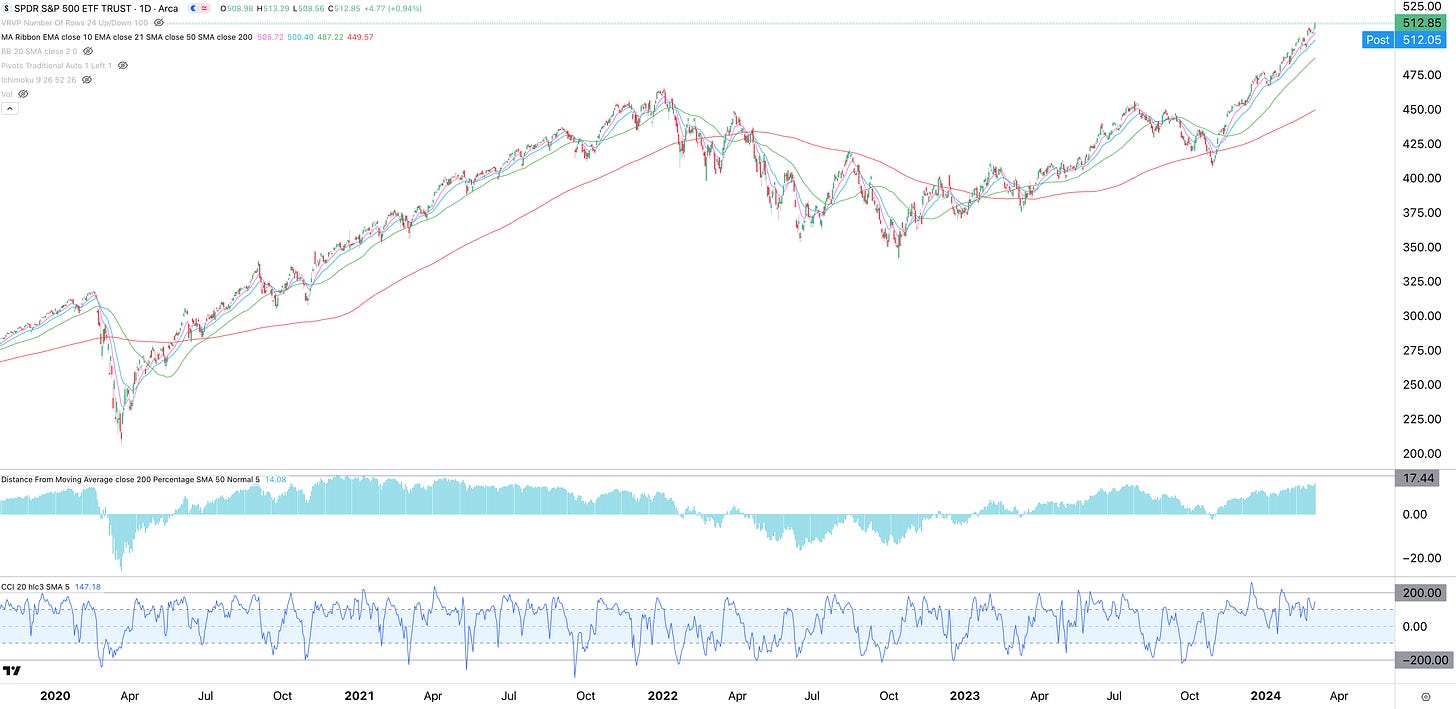
Could we have a blow-off top and reversal? Sure, it is possible. If so we see that historically the market runs into resistance when it gets stretched about 17% from the 200-week Simple Moving Average. That would be at the $527 level for SPY, so we should be mindful of this level…
…especially since it matches with an R3 Pivot point at exactly $527. Note that the SPY is following a 52-bar cycle bracket. That means some consolidation or pullback could occur in mid-to-late March, but a new cycle begins on 3/27. Does anyone smell a “Spring Rally” in the air?
Market Conditions: Buy the Dip Lives On
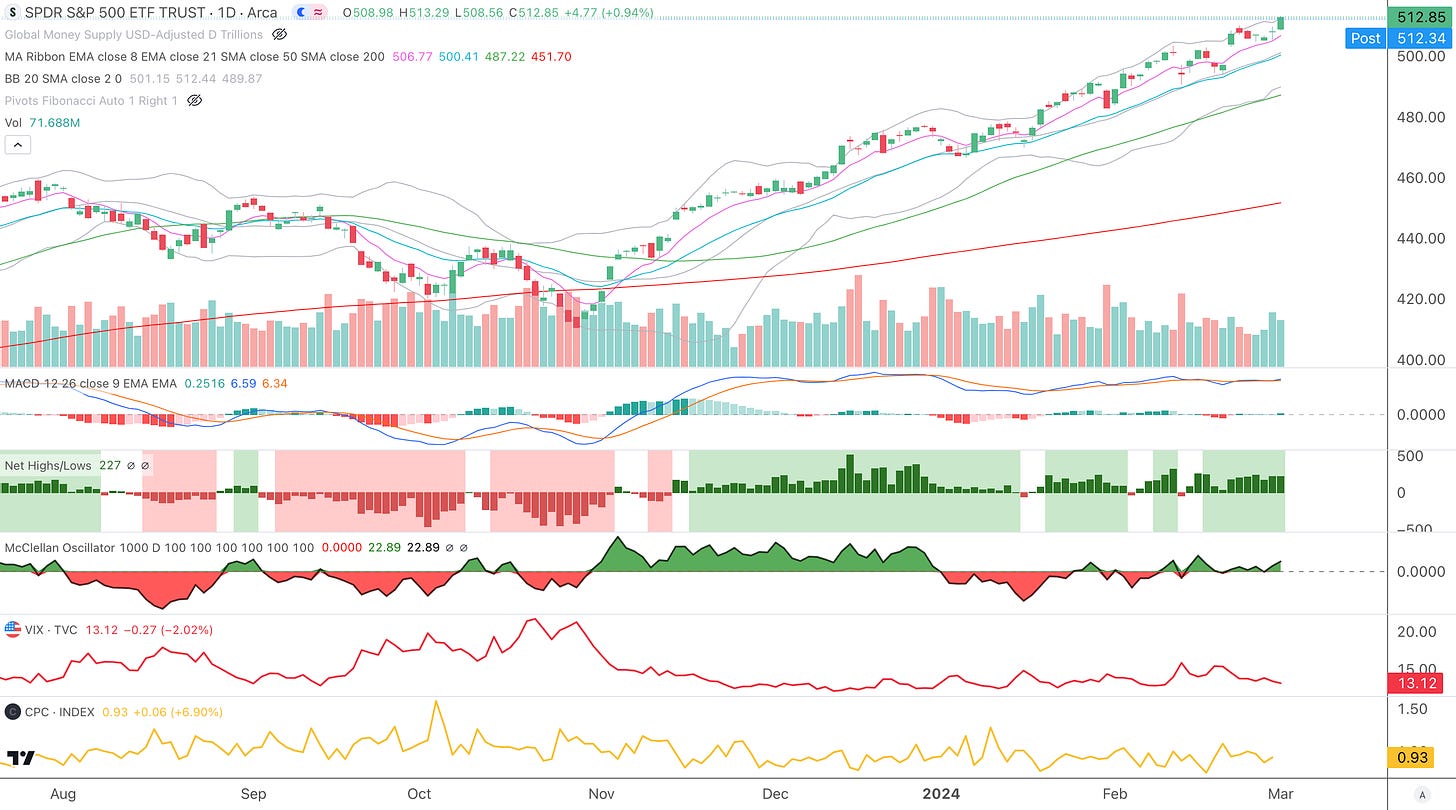
The S&P 500 continues to be a “Buy the Dip” market. This time, an orderly 4-day pullback to the 8 EMA (pink line) found buyers as the market found its footing on Thursday and popped on Friday. This latest pop occurred after Core PCE inflation numbers increased (albeit as estimated) last Thursday morning. The way the stock market reacted to increasing inflation makes us wonder if the Fed and inflation are currently less important in the minds of investors.
The key to the longevity of this rally is the way it pulls back before getting over-extended. Notice that when SPY jumps into the Upper Bollinger Band (grey bands) there is usually some pullback or consolidation to set up the next rally. The SPY is currently hovering near the Upper Bollinger Band so some chop, pullback, or consolidation is reasonable. In the Paid Subscriber section, we’ll discuss a money-making strategy for this environment.
Breadth: Breadth remains supportive of this rally as there are still a decent amount of Net New Highs. Moreover, the McClellan Oscillator is increasing but far from overbought.
Volatility: The VIX continues to decline, supporting higher prices.
Sentiment: The Put/Call ratio is neutral at the moment, but the Fear& Greed Model shows consistent Greed, fueling the “Buy the Dip” market. Greed appears to be riding high on AI optimism (refer to the Fear & Greed chart previously provided).
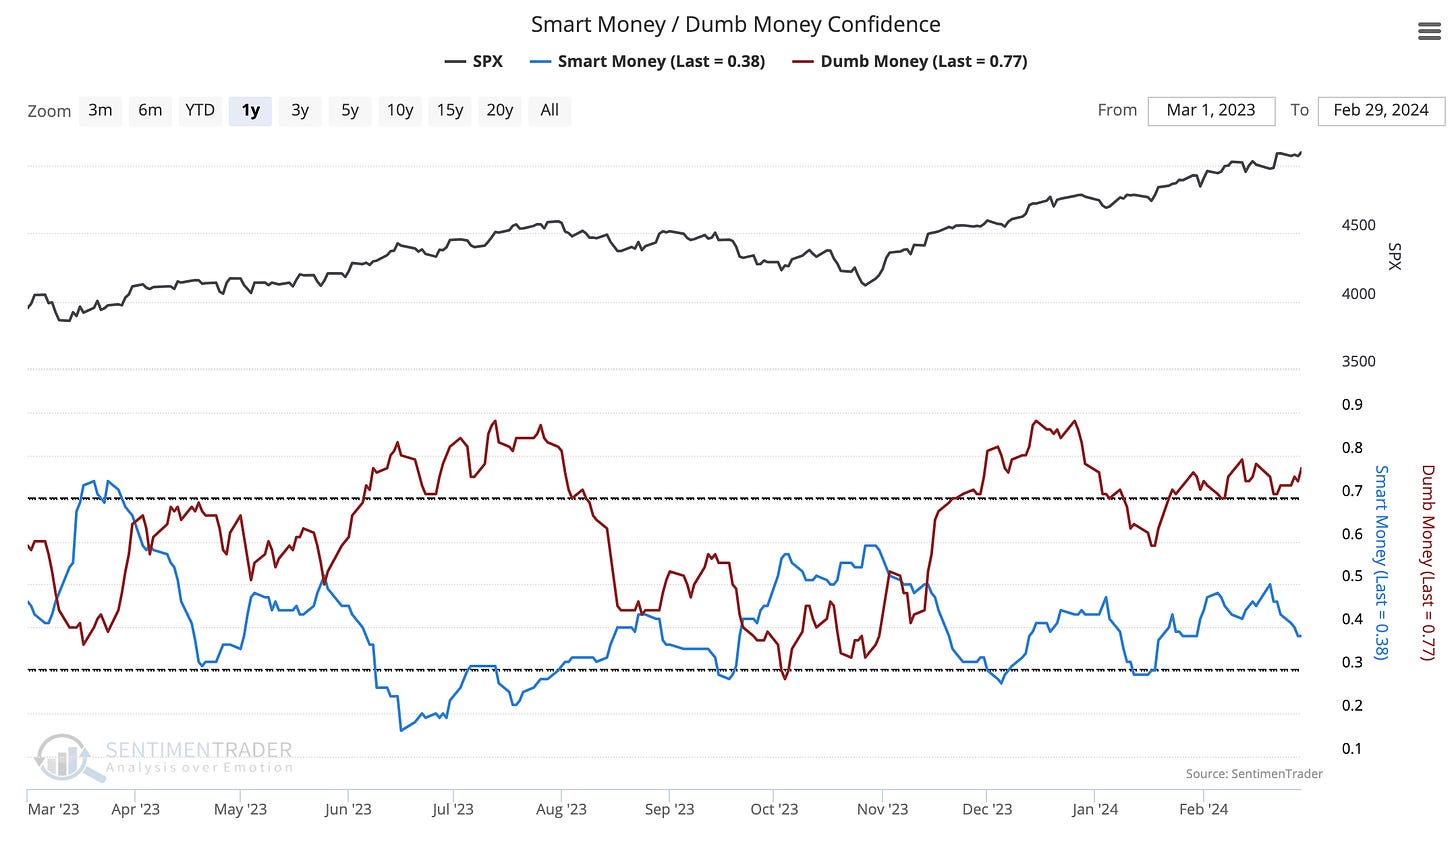
We can also see that the dips are being bought by Dumb Money or retail traders. Meanwhile, Smart Money seems to be selling high. In the age of Youtube and Substack, retail investors are more educated and informed than they were in the past, so I wouldn’t automatically assume Smart Money is right. Remember, Smart Money missed out on most of the November rally. Until something changes, “buy-the-dip” is working.
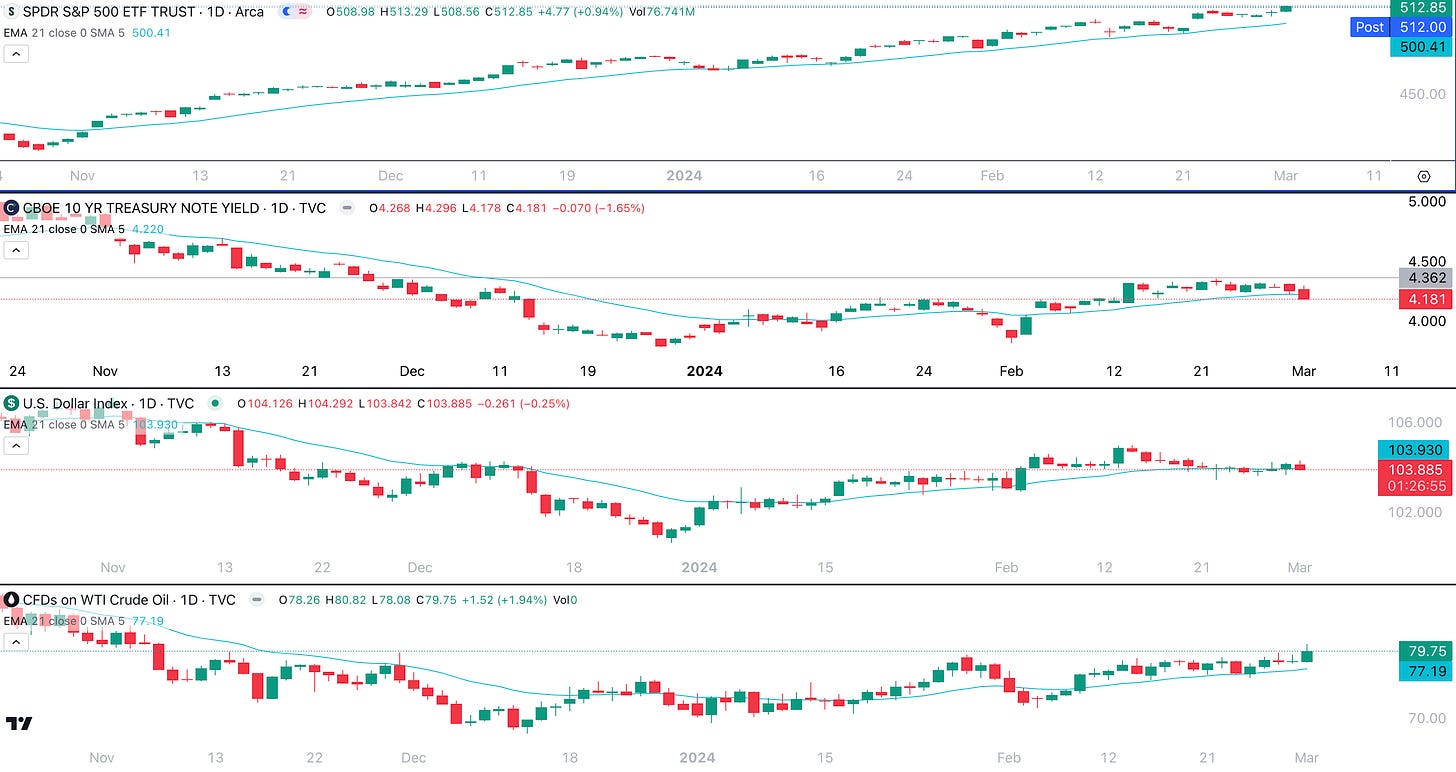
Intermarket Analysis: The 10-year Treasury rate and the US Dollar fell, which supports a risk-on rally.
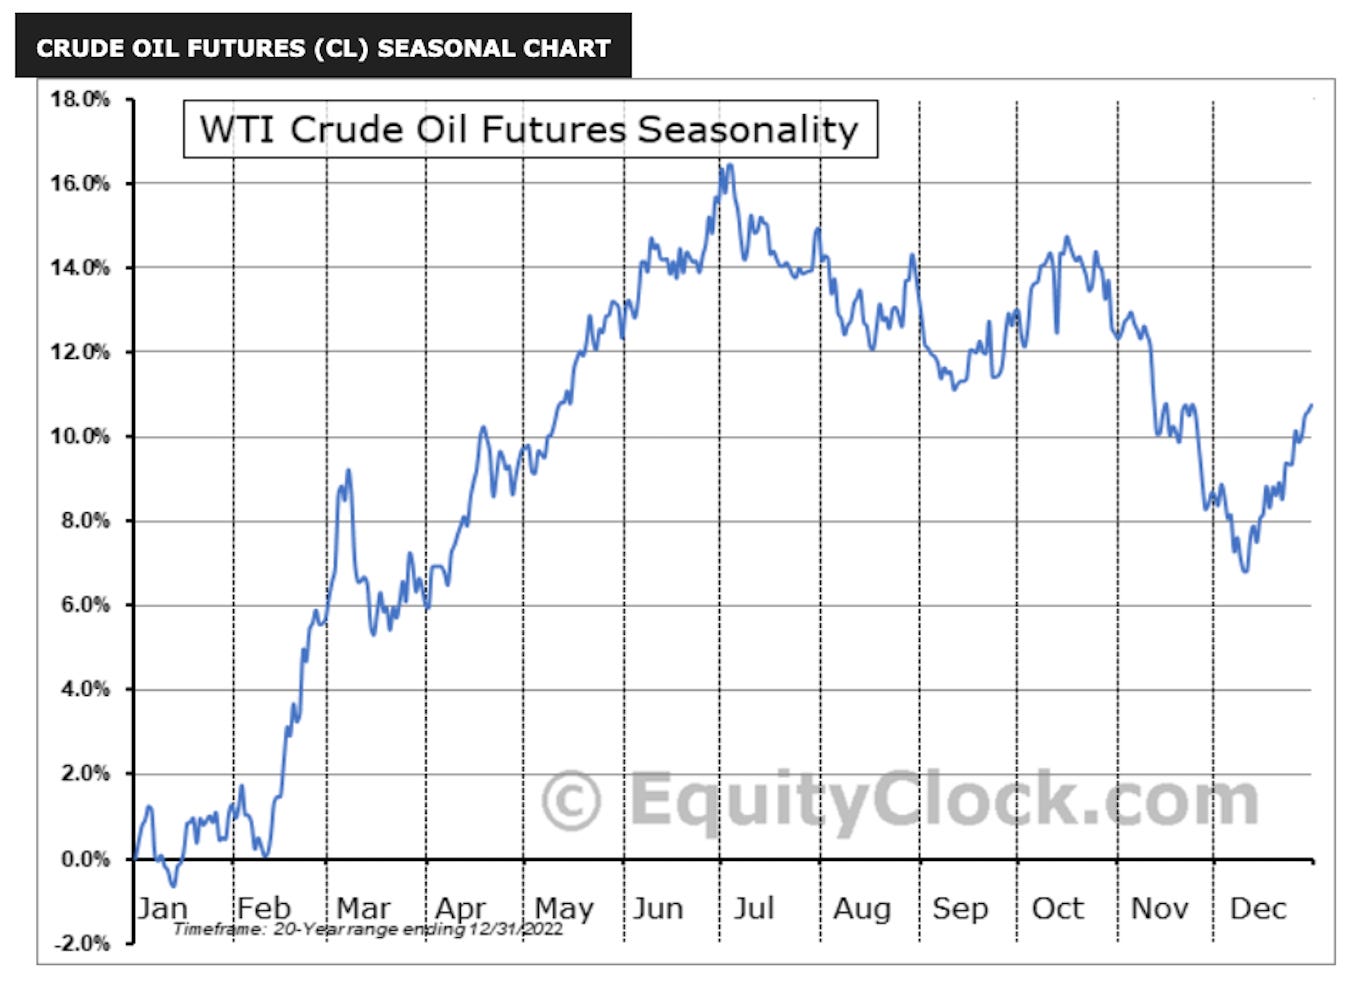
Oil is increasing as well. This dynamic could be seasonal, as oil often rises from February to early March.
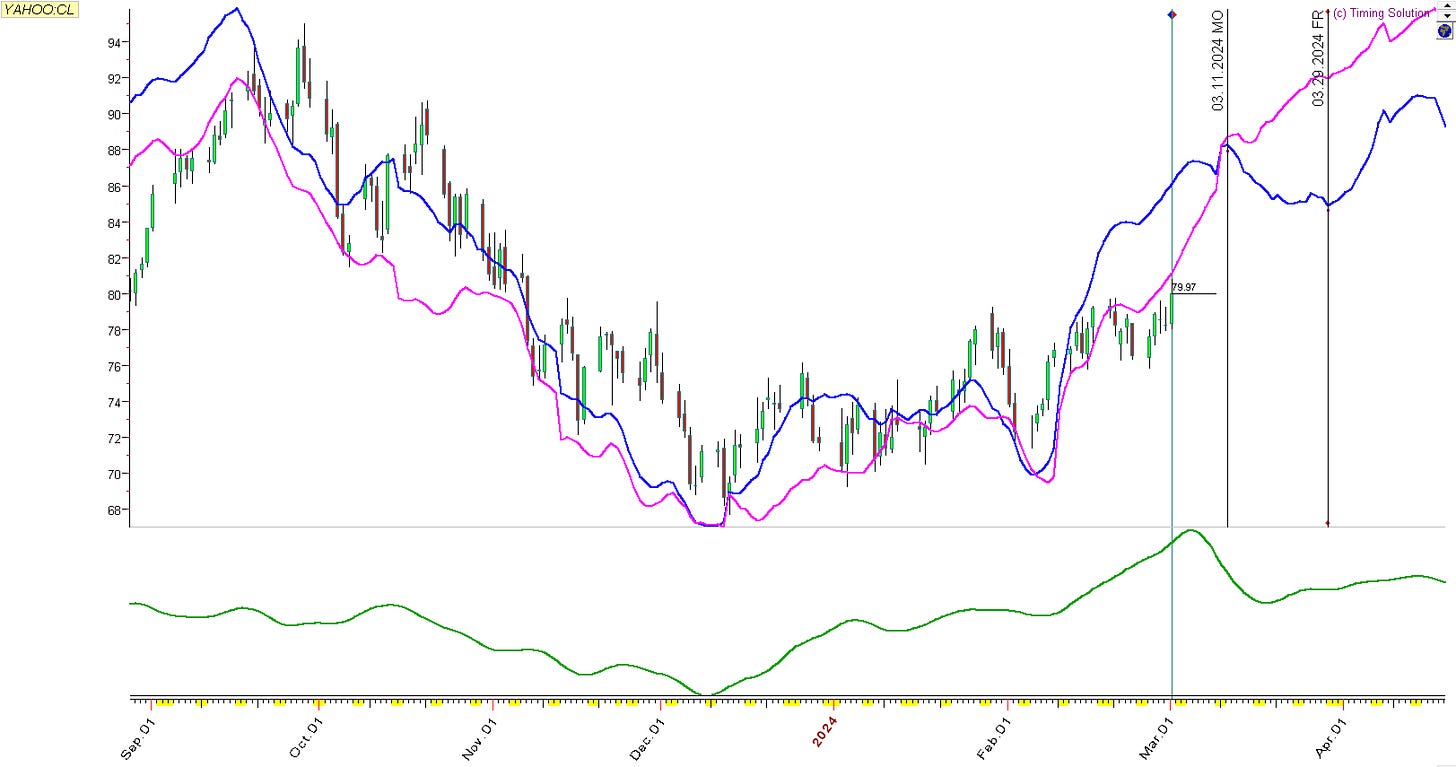
Our cycles however point to some strength in Oil into April. Increasing oil prices may continue to fuel inflation. Good thing the eye of the market if currently focused on other factors.
The Top Industry: Semiconductors
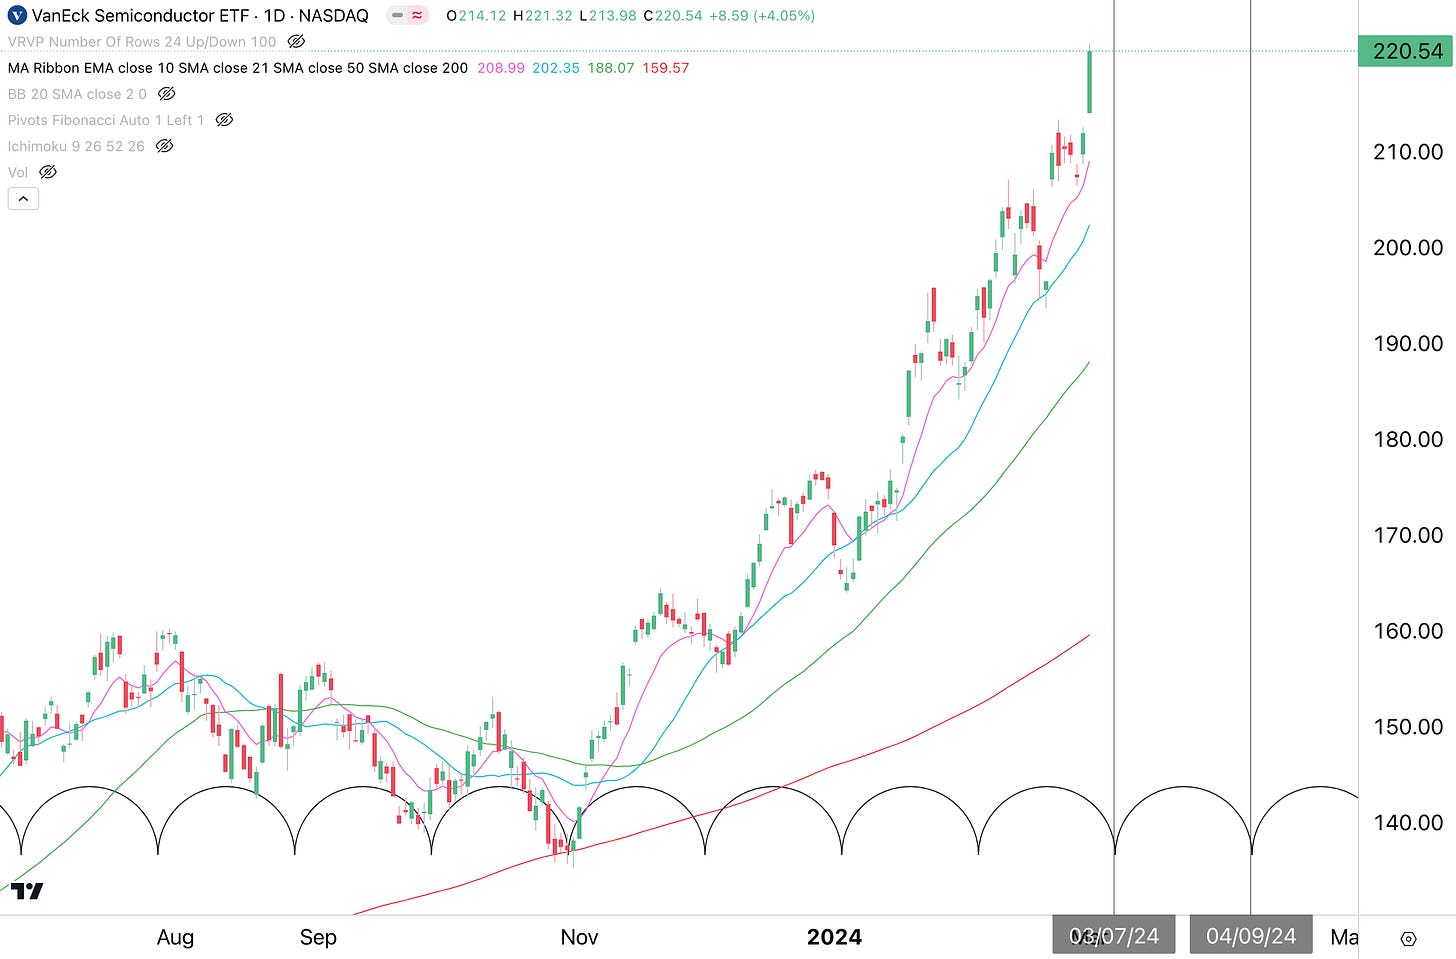
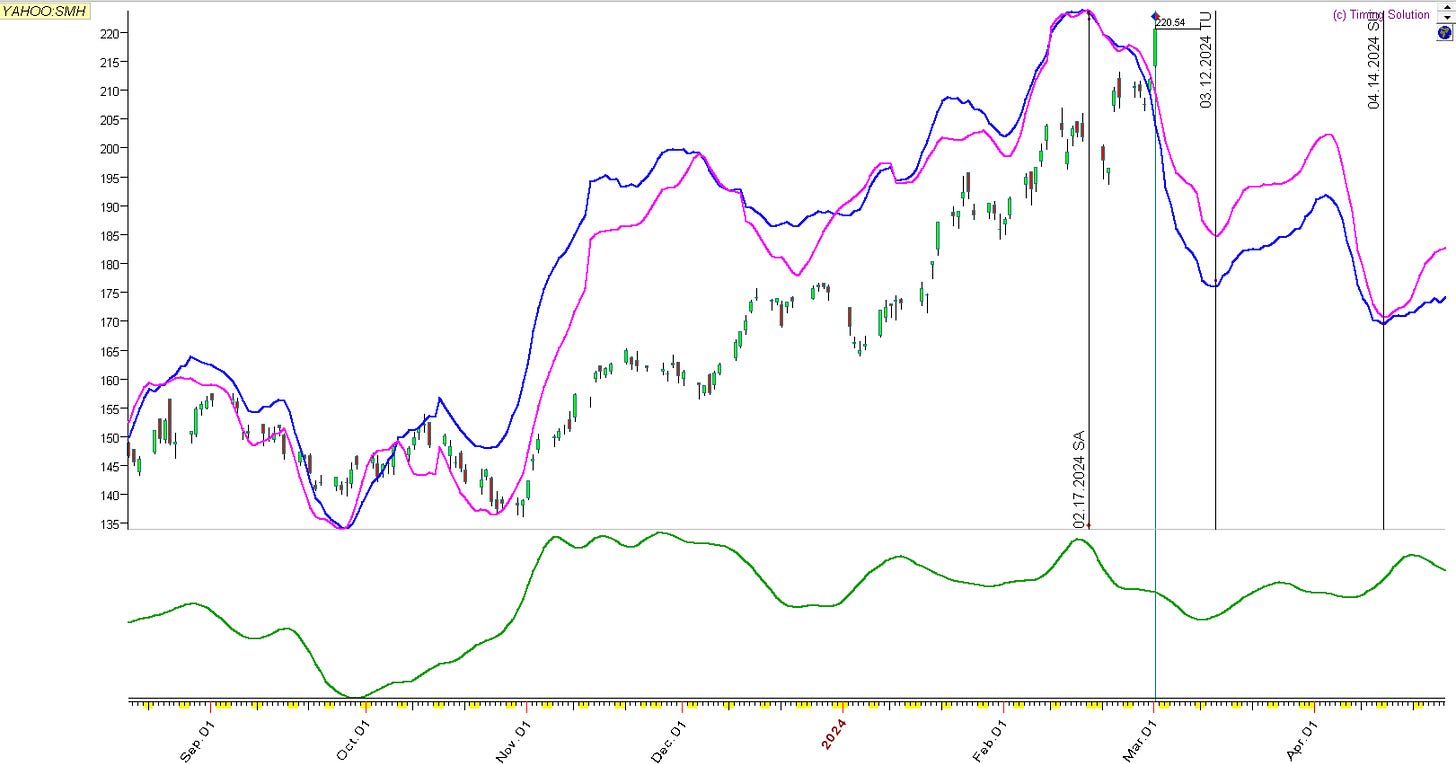
Semiconductors (SMH) are the leading industry this year and this will probably continue as long as the AI Boom does. Looking at the daily chart below, you can see that SMH is extended from the 8 EMA (pink line) after a strong drive following a 5-trading day consolidation. It is a bit extended now, however there may be an opportunity to buy at the cycle bracket troughs on 3/7 and 4/9.
The fundamental opportunity of AI is too strong for the cycles, which have been pointing down since 2/17. We can consider the down-cycle an inversion, driven by the AI opportunity. However, we could still use the cycles to see possible buy points on 3/12 and 4/14, which generally support the aforementioned cycle brackets.
In the Premium Section for Paid Subscribers, we’ll go over trading opportunities in Small Cap Growth (IWO) and Software (IGV). We’ll also disclose the trading strategy that we believe is working the best in 2024.
Disclaimer - All materials, information, and ideas from Cycles Edge are for educational purposes only and should not be considered Financial Advice. This blog may document actions done by the owners/writers of this blog, thus it should be assumed that positions are likely taken. If this is an issue, please discontinue reading. Cycles Edge takes no responsibility for possible losses, as markets can be volatile and unpredictable, leading to constantly changing opinions or forecasts.


