The Market's Character: "Not Done Yet"
Macro Narrative: The Spring rally is not done yet, however, last week’s drop in the unemployment rate brought back old fears that strong employment will prolong sticky inflation and the Hawkish Fed. The 2 and 10-year Treasury rates spiked as the Fed Watch Tool now predicts a 71% chance of a 25 basis point increase in the Fed Funds Rate at the May 3rd FOMC meeting. The market remained resilient in the face of these developments, which shows us that the market is less focused on interest rates at the moment.
Oscillation Cycle: Despite the recent interest rate increase, the Spring Rally continues as the SPY stays above the 10 and 20-day moving averages. The NYAD Breadth Oscillator, and the Bullish % of SPX Stocks ($BPSPX) both continue to move higher. The CCI Indicator reached the overbought level, but on previous upswings, it spends a good amount of time there before reversing. The TRIX indicator is in an early upswing and shows no signs of making a bearish crossover yet.
The Percent of S&P 500 Stocks Above the 50-Day Moving Average is currently at 48. On previous upswings, this indicator got to the 78 to 92 area before reversing. This hints that the current rally still has gas in the tank.
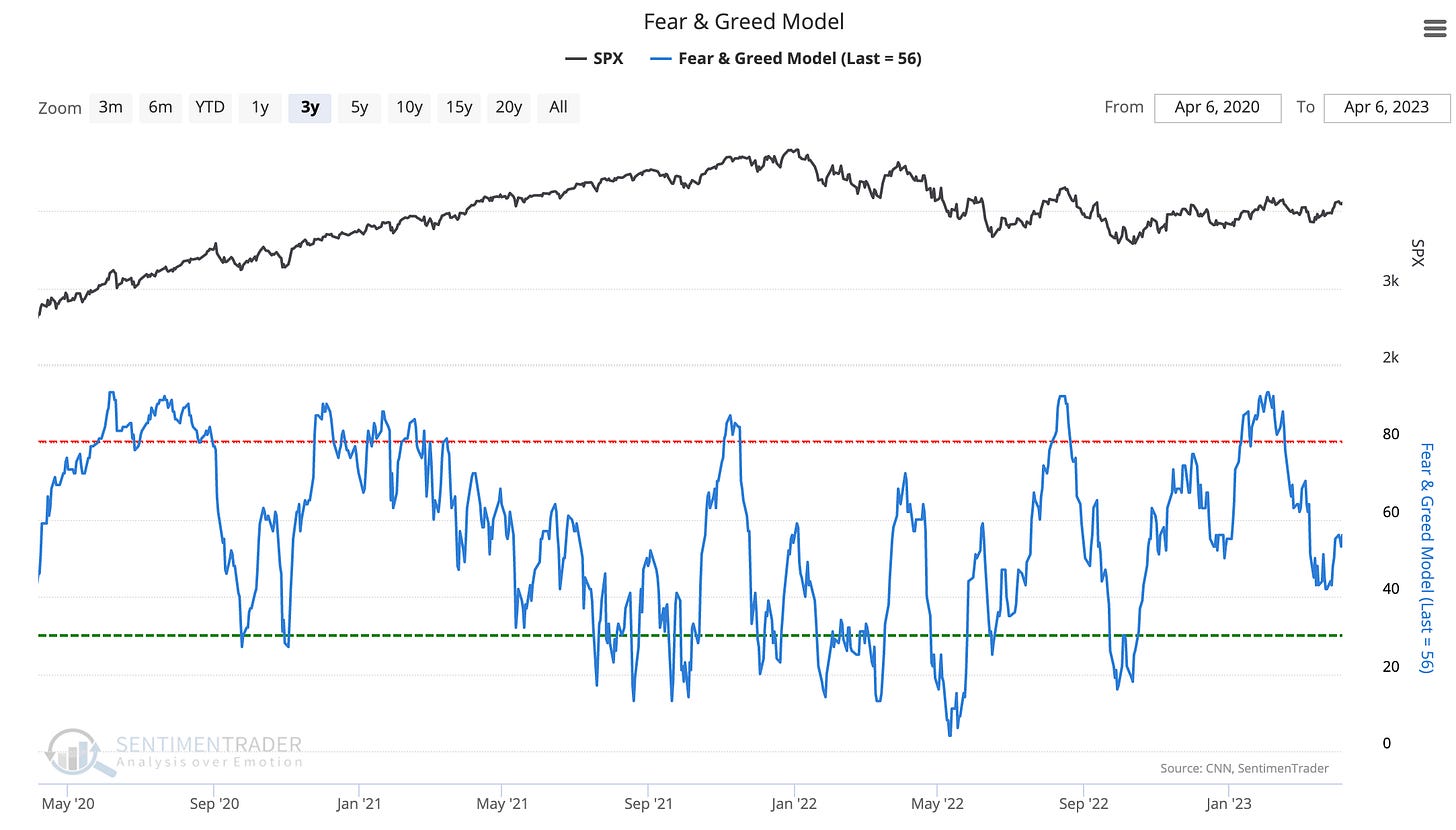
The Fear & Greed sentiment model also shows that it has a way to go before it gets overbought.
The Smart Money / Dumb Money Confidence model shows that Dumb Money is not overbought yet. When the red line gets above 0.7 and falls back down below that level, that is usually the signal of a possible trend reversal.
Ichimoku Cloud Model: Let’s take a look to see how different ETFs and stocks are holding up using the Ichimoku Cloud model.
SPY (S&P 500) is above the cloud and above the Conversion Line (blue line) and the Base Line (red line). It did stall at the R1 Pivot Point, however, it is possible that it continues to trend up to the R2 Pivot Point at $418 or the R3 Pivot Point at $429. The low volume on the recent red days tells us that institutions are not selling out yet. The RSI has room to run and the MACD is above 0 and continuing higher. A bearish crossover on the MACD could tell us when it is time to protect profits.
QQQ (Nasdaq 100) is above the cloud, the Conversion Line, and the Base Line. It is finding support on the Conversion line, increasing the probability of a continued move higher. Notice that the MACD is close to making a bearish crossover however. This tells us that it is getting late in the game for the rally in the Nasdaq 100.
DIA (Dow 30) is also above the cloud, Conversion Line, and Base Line. It appears to be playing catch-up with the QQQ. It is possible that with the recent increase in interest rates, the more value-based stocks will begin to outperform growth and tech stocks. This should bode well for DIA.
IWM (Russell 2000) is the clear laggard as this index contains many regional banks and finance companies. It is below the cloud, the Conversion Line, and the Base Line, indicating weakness. The MACD is also under 0, confirming the picture of weakness. On the bright side, it was up much more than the other indices today, so it may play catch-up now.
XLP (consumer staples) has been very strong and is above the cloud, Conversion Line, and Base Line. The strength of this defensive sector does indicate a flight to safety flavor for this rally. This combined with the relative weakness in IWM provides a warning that more economic and/or market pain could be in store later this year.
XLY (consumer discretionary), an offensive sector ETF, has been relatively muted this up-cycle. The fact that XLY is weak compared to XLP strengthens the warning for future pain to come later this year.
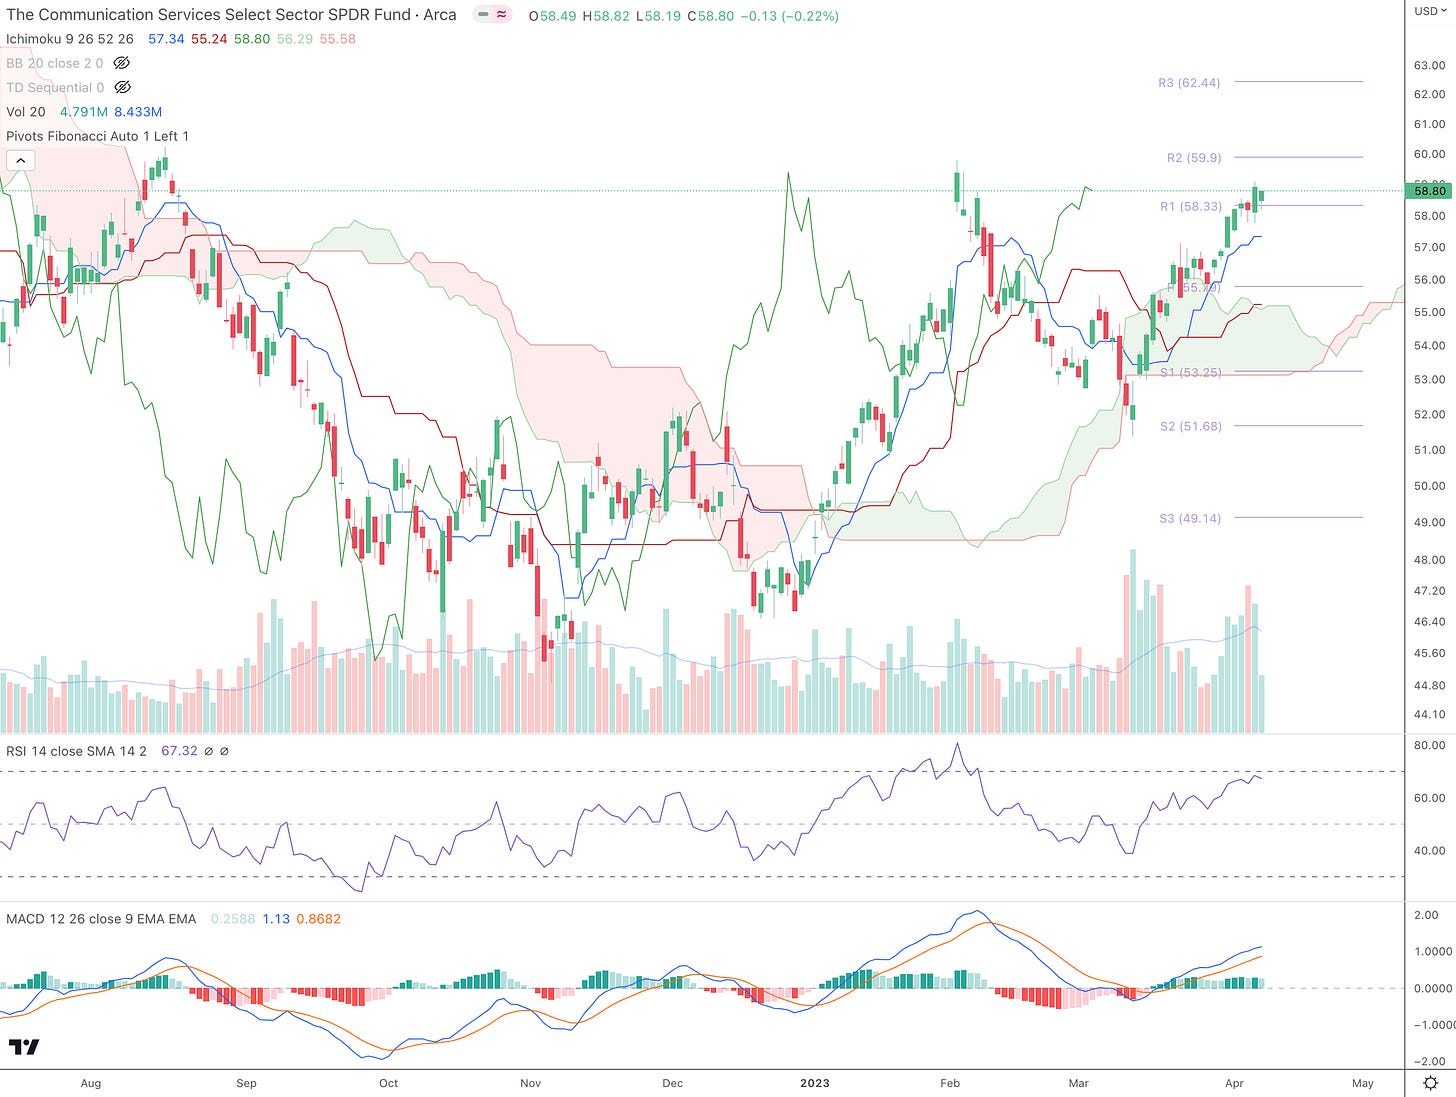
XLC (communicators) has been a leader during this up-cycle. Stocks like META and GOOGLE, which have attractive P/E to growth ratios, have bolstered the strength of this sector. It is above the cloud, Conversion Line and Base Line. This ETF is likely to reach the next resistance pivot points at $60 or $62.
XLV (healthcare) finally found buyers, after a tough start in 2023. The sector was undervalued, which explains the recent spike in buying. The increase in interest rates has a tendency to support value stocks as opposed to growth stocks. Since this is already at the R3 Pivot Point, a pullback to the Conversion Line could provide a good entry point to buy.
Cycle: Much of this article sounds like “the market is in an uptrend for now, but watch out for trouble later this year”. Here is the Cycle Composite for the S&P 500 for the rest of 2023, which could help us plan for when trouble actually could come:


