


The Non-Factor FOMC in a Holding Pattern

NOTE: We’re going to be raising our membership prices across all tiers very soon.
Monthly would increase from $30 to either $35 or $40.
Yearly would increase from $240 to $350.
Founding Member (with Discord access) would increase from $600 to $800.
If you want to secure our current pricing with a guarantee to always get that price throughout your membership (irrespective of any price increases), then now would be the perfect time to do it!
FOMC Results: Holding Pattern
Today’s FOMC meeting ended with the Fed holding rates steady at 4.25% to 4.50%. During Chair Powell’s speech, it became clear that the Fed is in a holding pattern—acknowledging rising stagflation risks and growing uncertainty around tariffs. And how did the market respond? Like it was a nothing burger.
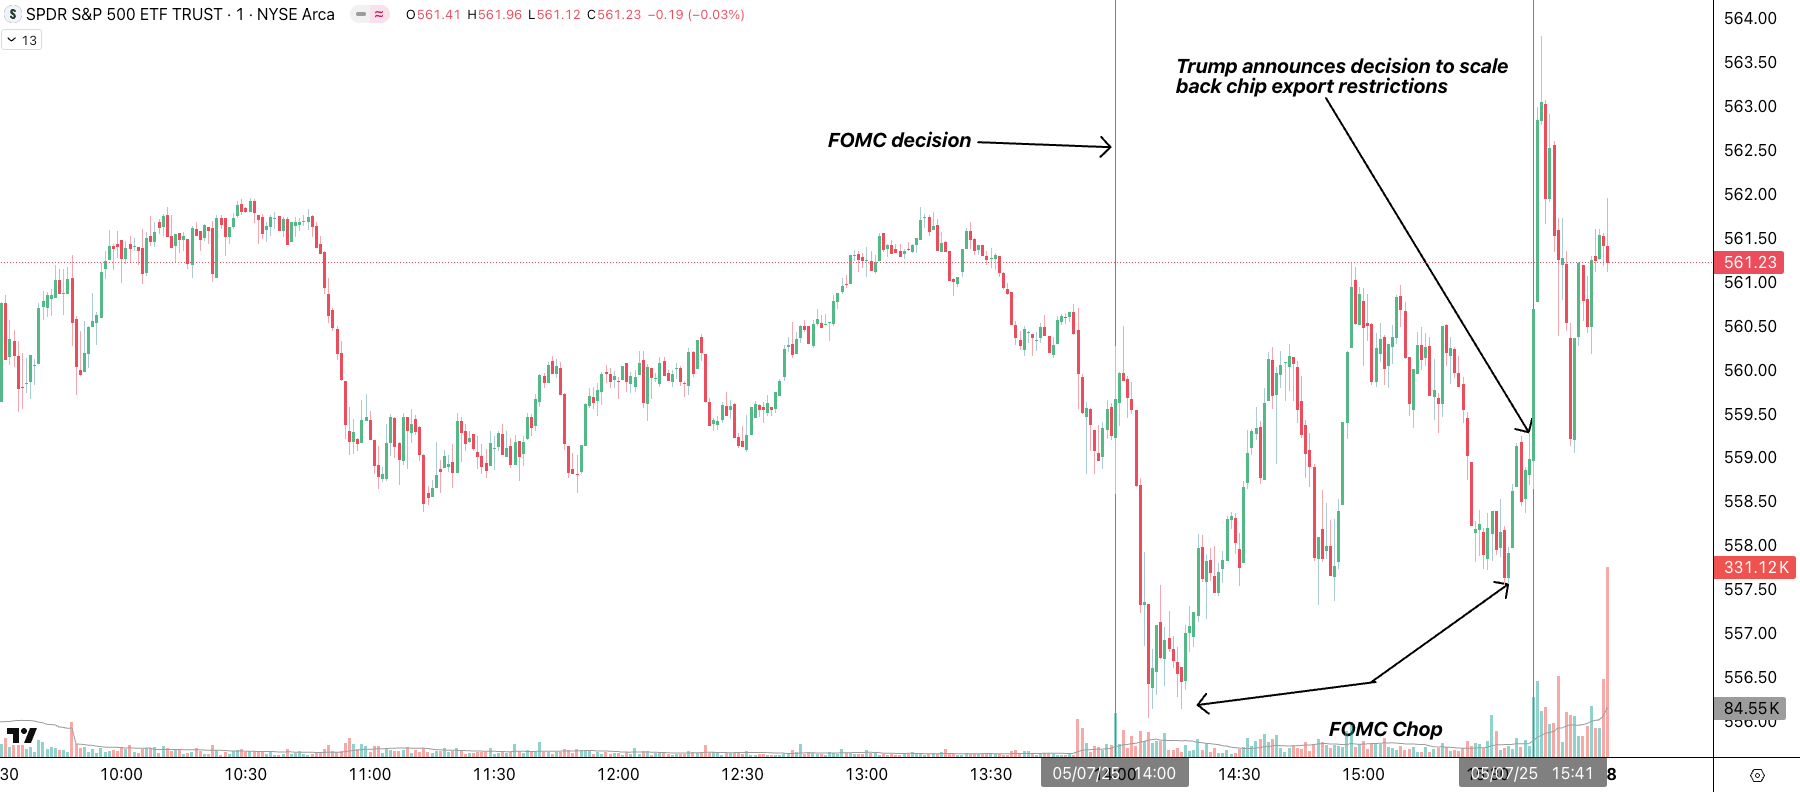
Below is a 5-minute chart of today’s trading session. The market was mostly sideways throughout the day. When the FOMC announced its rate decision at 2:00 p.m. EST, the S&P 500 (SPY) dipped slightly but quickly reversed and continued to chop sideways during Chair Powell’s speech and Q&A session. Then, around 3:41 p.m. EST, Trump announced a rollback of semiconductor export restrictions—widely seen as a goodwill gesture ahead of potential engagement with China. SPY spiked on the news. This suggests that, for now, the Fed is a non-factor and the market’s focus has shifted to Trump’s tariff policies.
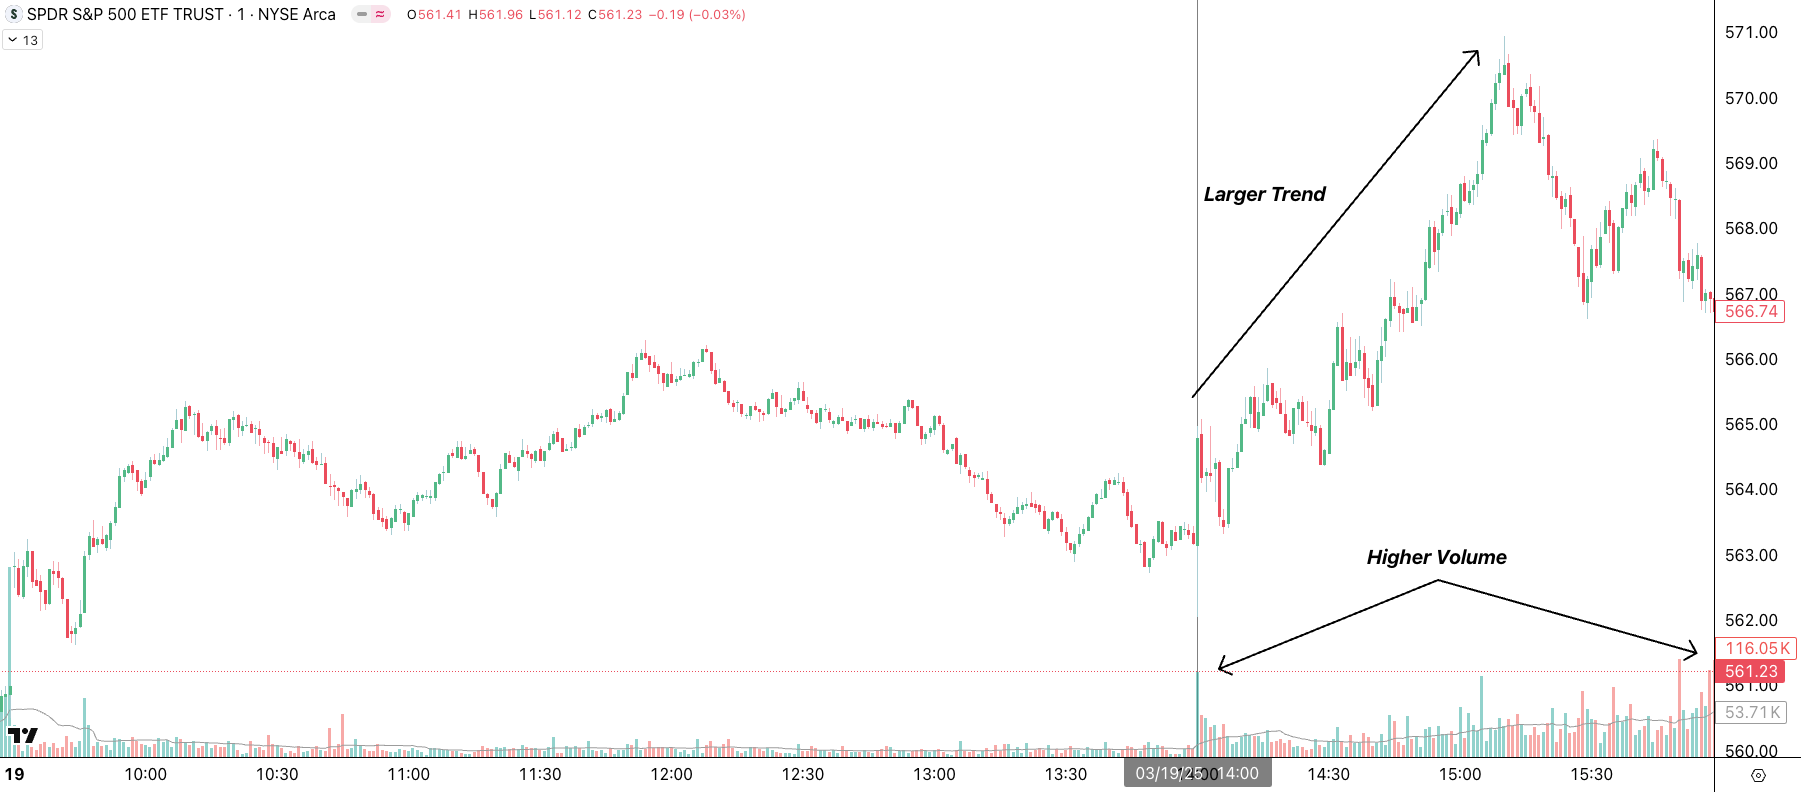
By comparison, the chart below is a 5-minute chart of the last FOMC day on March 19th. Notice that there was a larger trend after the FOMC rate decision at 2pm EST and significantly higher volume. Things are changing, and it seems like the Fed is holding less power.
Market Conditions: Holding Pattern
After a strong April, the SPY also appears to be in a holding pattern. It is still in an uptrend as it is trading above the 9, 21 and 55 EMAs (green, yellow & red respectively). However it cannot yet muster the strength to break above the 200 SMA (purple). Part of the reason could be that it is trading at the Volume Profile Point of Control (POC) where most share have been traded. This tends to works like a magnet for price.

Meanwhile it seems like breadth is overbought, and this may be hitting the brakes on the rally. Notice that the Nasdaq Stocks above the 20 SMA (NDTW) is in overbought territory and has started to trend down. Similarly8 the McClellan Breadth Oscillator came off it’s highs. The Net New Highs are pretty flat as well. The VIX Curve (VXV/VIX) is above 1.00 and heading higher, which is a bullish event. The VIX is continuing to drift lower, which is also supporting risk assets. Where Breadth is a headwind, Volatility appears to be a tailwind and the combination of the two seem to yield a holding pattern.
Technical Analysis: Holding Pattern
Let’s take a closer look at SPY using the 4-hour chart below. We’re currently in an uptrend from the April lows (green trendline). However, over the past few trading sessions, a short-term downtrend has emerged (red trendline). This red trendline has proven significant—it rejected yesterday’s rally on news of U.S.-China talks, and again today when Trump announced a rollback of semiconductor export restrictions.
For now, the $556 level (yellow horizontal line) is acting as support, with buyers stepping in on each dip. If that level breaks, watch for a confluence support zone around $546, marked by the green uptrend line and the Anchored VWAP from the February highs (black).
The RSI is trending lower but holding above the 50 level, signaling a weak short-term downtrend within a broader uptrend. Meanwhile, the MACD is drifting lower but remains above the zero line, suggesting this may just be a pause in the uptrend.
In short, SPY appears to be in a holding pattern.

Seasonality & Cycles: Holding Pattern
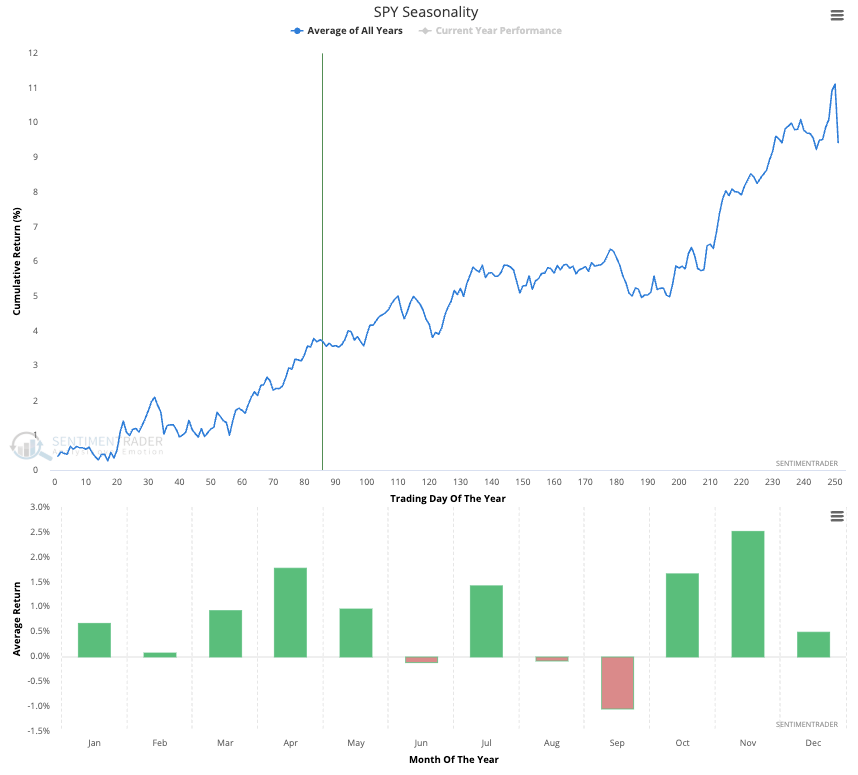
The Seasonality chart for the SPY below shows sideways consolidation until late May, when it points higher.
Our Cycles Forecasts point to a down-cycle between 5/6/25 to 5/14/25. This will be followed by…
Disclaimer - All materials, information, and ideas from Cycles Edge are for educational purposes only and should not be considered Financial Advice. This blog may document actions done by the owners/writers of this blog, thus it should be assumed that positions are likely taken. If this is an issue, please discontinue reading. Cycles Edge takes no responsibility for possible losses, as markets can be volatile and unpredictable, leading to constantly changing opinions or forecasts.