The Nothing-Burger Market of 2023
The stock market in 2023 is a frustrating hot mess for many investors and traders. Fundamentals are weak as the economy is teetering on the edge of an expected recession as stocks are at a relatively high valuation. This combination is not attractive enough to get the money sitting on the sidelines in CDs and treasuries to buy into equities.
Technically, the stock market is trapped in a range. The chart below shows how the SPY is forming a sideways consolidation pattern between compressing Bollinger Bands right on the Volume Profile Point of Control (POC). This is where most shares are traded and often serves as a magnet to price, as it is now. Volume shows more selling than buying as the Money Flow Index (MFI) is in a downtrend. I believe a catalyst would be needed to get this market out of its current range. Either some positive news or lower prices could attract new buyers. I believe it will be the latter and I expect the SPY to eventually reach the S3 Pivot Point at around $400.
With fundamentals and technicals in a holding pattern, this is the perfect time to look at cycles for an edge. In the next section, I’ll look at the cycle arcs and cycle forecasts for the major indices.
S&P 500 Cycles
We could see that the SPY is making 52 trading day cycles using cycle arcs. A declining phase should be coming up over the next few days, with an expected bottom around 5/29. Price is under the 50-day Hull Moving Average, so odds are on the side of growing weakness in the second half of May. If a decline does not occur, it would display an underlying strength in the market and possibly hidden buyers. Either way, the current cycle should end around 5/29.
Looking at the cycle chart below, there is a possibility that the next cycle (after 5/29) could be a “left-translated” down-cycle. The Cycle Composite and Seasonal Cycle both forecast down-cycles from 6/5 to 6/25.
Nasdaq 100 Cycles
The QQQ is in a wedge pattern, which is usually followed by a drop. This would coincide perfectly with the declining phase of the current cycle. Similarly, the current cycle is expected to end around 5/29.
The Cycle Composite and Seasonal Cycle for QQQ show a more bullish configuration and show potential buy points on 5/22 and 6/14. I will look to add exposure on dips in the upcoming weeks. Given QQQ’s relative strength this year compared to the greater market, the potential reward is worth the risk. In my buy-and-hold account, I will accumulate shares of PTNQ, which invests in the Nasdaq 100, but has a downside protection mechanism — if the Nasdaq 100 falls below the 200-day moving average the equity exposure is swapped for treasuries.
Dow Jones Industrial Average Cycles
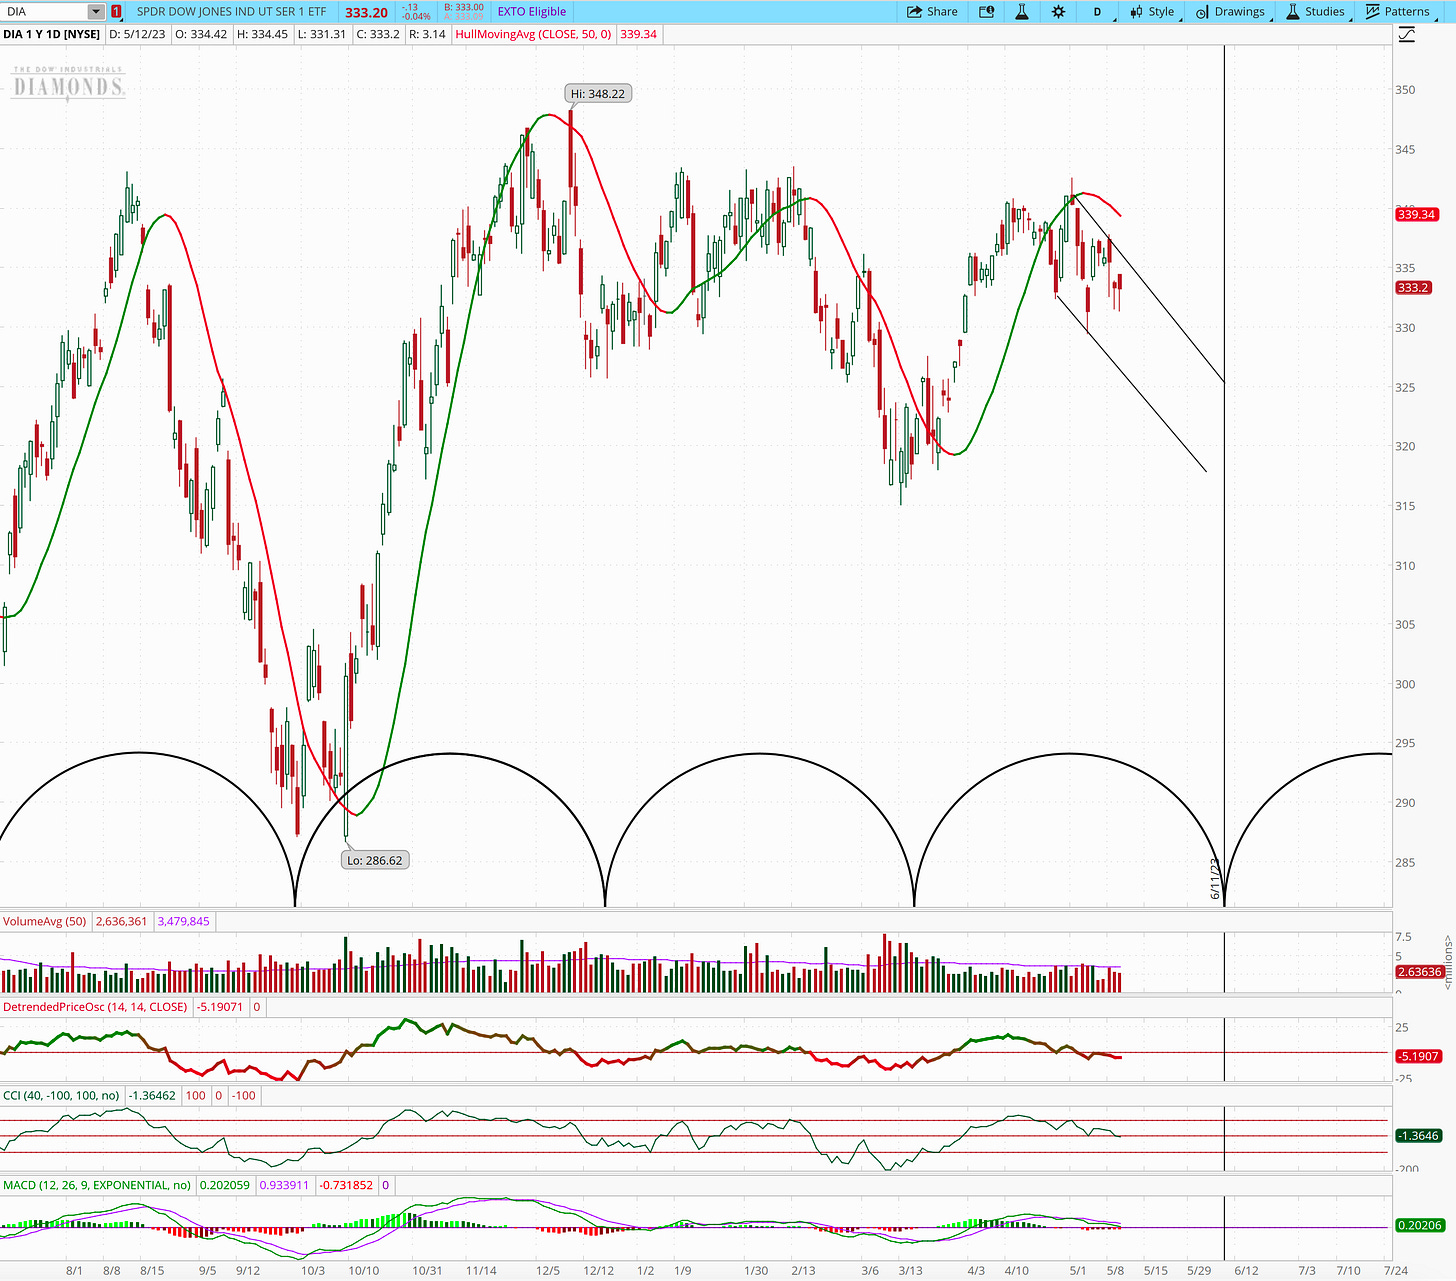
DIA’s current cycle will end around 6/11, which is slightly different from SPY and QQQ. The price seems to be in a downward channel, hinting that lower prices are to come.
The Cycle Composite and Seasonal Cycle point to a weak configuration in the next cycle. I believe that there is a good chance that the next cycle (after 6/11) could be a down-cycle. Dow stocks tend to be “real economy”, instead of “virtual economy”, and could materially feel the effects of higher interest rates and possibly the ongoing banking issues. I may look to short DIA around 6/7 to 6/11.
Russell 2000
IWM has been chopping sideways near the low. As the declining portion of the cycle will be beginning at any moment, price could make an attempt to break below the previous lows. The cycle will end around 6/19.
Looking at the Cycle Composite and Seasonal Cycle, we could see that IWM was forecasted to have an uptrend from mid-March to 6/6. This did not happen, hinting at an underlying weakness in the Russell 2000. This index holds many regional banks and which probably weighed it down. The cycle forecasts point to a down-cycle beginning around 6/6 and this could possibly make for a good short trade.
Conclusion
Upcoming months could show a continuation in the trend of an outperforming Nasdaq 100 and lagging Dow Jones Industrial Average and Russell 2000. This could be textbook business cycle and sector rotation. As we make out way to the Full Recession and Market Bottom segment, the technology and consumer discretionary sectors could pull ahead. Technology already has. I hope that the cycles analysis included in this post will help us profit at the right times while avoiding dangerous down-cycles.
Disclaimer - All materials, information, presentations and ideas from Cyclesedge.com are for educational purposes only and should not be considered financial advice. For specific advice, one should consult a registered Financial Advisor. Nothing presented here should be considered as specific investment, stock, option, ETF, future, commodity advice. This blog may document actions done by the owners of this website, thus it should be assumed that positions are taken. If this is an issue, please do not continue using this website. All investments contain risk and some positions could lose more than the initial investment value. All readers must manage their own risk. This website takes no responsibility for possible losses, as the financial markets are volatile and unpredictable and opinions and forecasts provided here could be wrong. Past performance is not indicative of future results. Hypothetical or simulated performance based on past cycles or future projections have limitations and have no guarantee of being able to predict the future. Cycles can contract invert or extend in unpredictable ways. Past performance does not guarantee future results. This website provides no advice.


