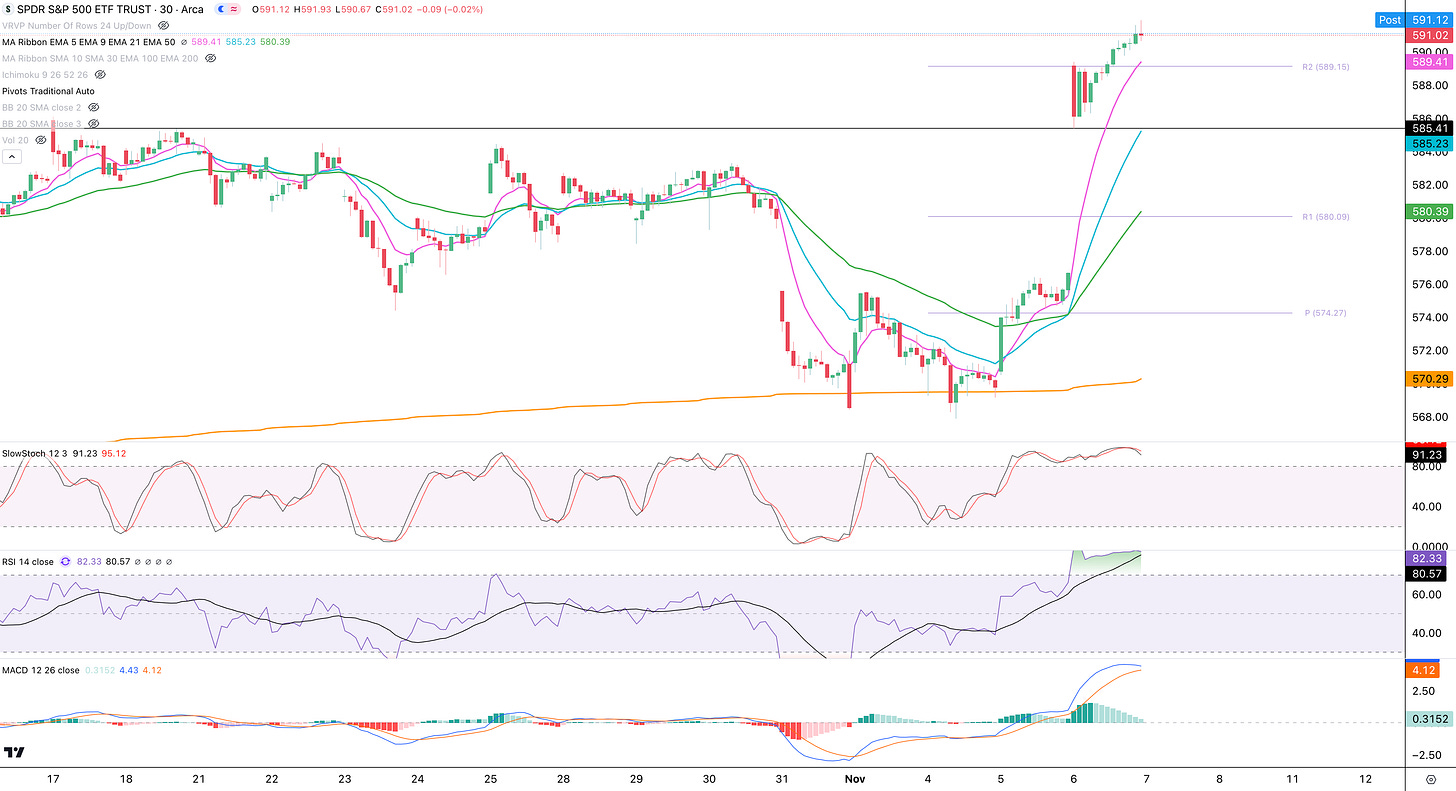
The people have voted and the next US President has been chosen. As expected, Wall Street is having it’s typical Post-Election Rally as the markets like certainty. The S&P 500 (SPY) is up 2.49% today. It is now back in an uptrend trading above the 9 & 21 Exponential Moving Averages (EMAs). The next resistance may come at the R2 Pivot Point at around $594. The Slow Stochastics indicator did well in timing the bottom, which came at the confluence of the 50 EMA (green), Lower Bollinger Band (lower blue band) and Anchored Volume Weighted Average Price (AVWAP, orange line). With RSI above 50 and MACD about to make a bullish crossover, this rally could have legs.
Large Technology is expected to benefit from a Trump Presidency. As such, the Nasdaq 100 (QQQ) rose 2.72% today and broke out to a new high. The next resistance may come at the R2 Pivot Point around $511.
The Russell 2000 (small caps) was up 5.79% today. IWM’s relative strength was driven by it’s high percentage of finance companies. The Financial sector is expected to profit from a Trump Presidency.
You can see from the chart below that Financials had significant relative strength to the market today, followed by Industrials, Energy, and Communication Services.
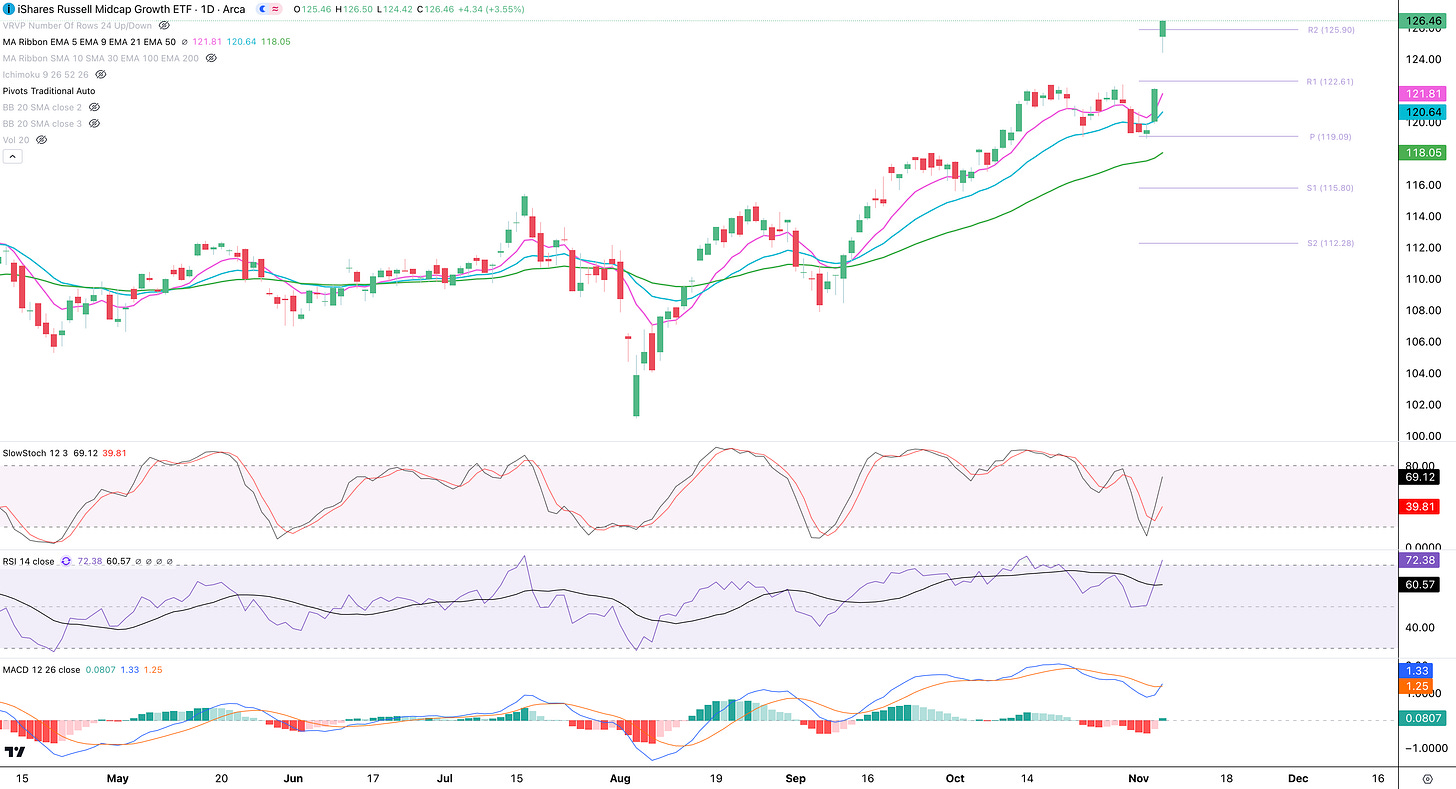
MidCap Growth (IWP) notably outperformed today, as it appreciated 3.55% today. This relative strength is expected to continue.
Breadth is overall supportive as the NYSE Advance/Decline Line ($NYAD) bounced off the Lower Bollinger Band and 50 SMA. The NYAD is expected to hit the Upper Bollinger Band or make new highs. Either way, this bullish trend should be just beginning.
It is strange however that the VOLD (Advance/Decline Volume, middle) spiked, while the ADD (Advance/Decline Issues, lower) was positive but sluggish.
We believe this occurred because institutions were caught underinvested in equities, likely due to the VIX’s recent spike above the 20 mark. As a result, they likely bought SPY and QQQ to quickly increase their portfolio exposure. This tactic, known as “Beta Catching”, is used to avoid lagging behind index performance. Their scramble to add exposure could create a “Lockout Rally”, where the market continues to trend higher without significant pullbacks.
The chart below is the 30-Minute chart of the SPY. You can see how the Election created a large gap, and although their was some profit-taking in the morning, there were many willing buyers, keeping the uptrend going. If this is really a Lockout Rally, the gap will not be filled, as the SPY continues to trend above the 9 EMA or 21 EMA on the 30-Minute chart.
This is the time to buy the dip, however expect some volatility on Thursday as it is an FOMC day.
Disclaimer - All materials, information, and ideas from Cycles Edge are for educational purposes only and should not be considered Financial Advice. This blog may document actions done by the owners/writers of this blog, thus it should be assumed that positions are likely taken. If this is an issue, please discontinue reading. Cycles Edge takes no responsibility for possible losses, as markets can be volatile and unpredictable, leading to constantly changing opinions or forecasts.


