Last week was an expectation breaker. Hot inflation mixed with a Fed that reiterated the need for proof of disinflation to cut interest rates broke the uptrend. On top of that, increased geo-political tensions between Iran, Israel, and the US are forming a possible black swan waiting on the sidelines. Finally, JPMorgan kicked off earnings season with comments about inflation challenges and interest rate uncertainty, which appeared to be the straw that broke the camel’s back.
Market Analysis
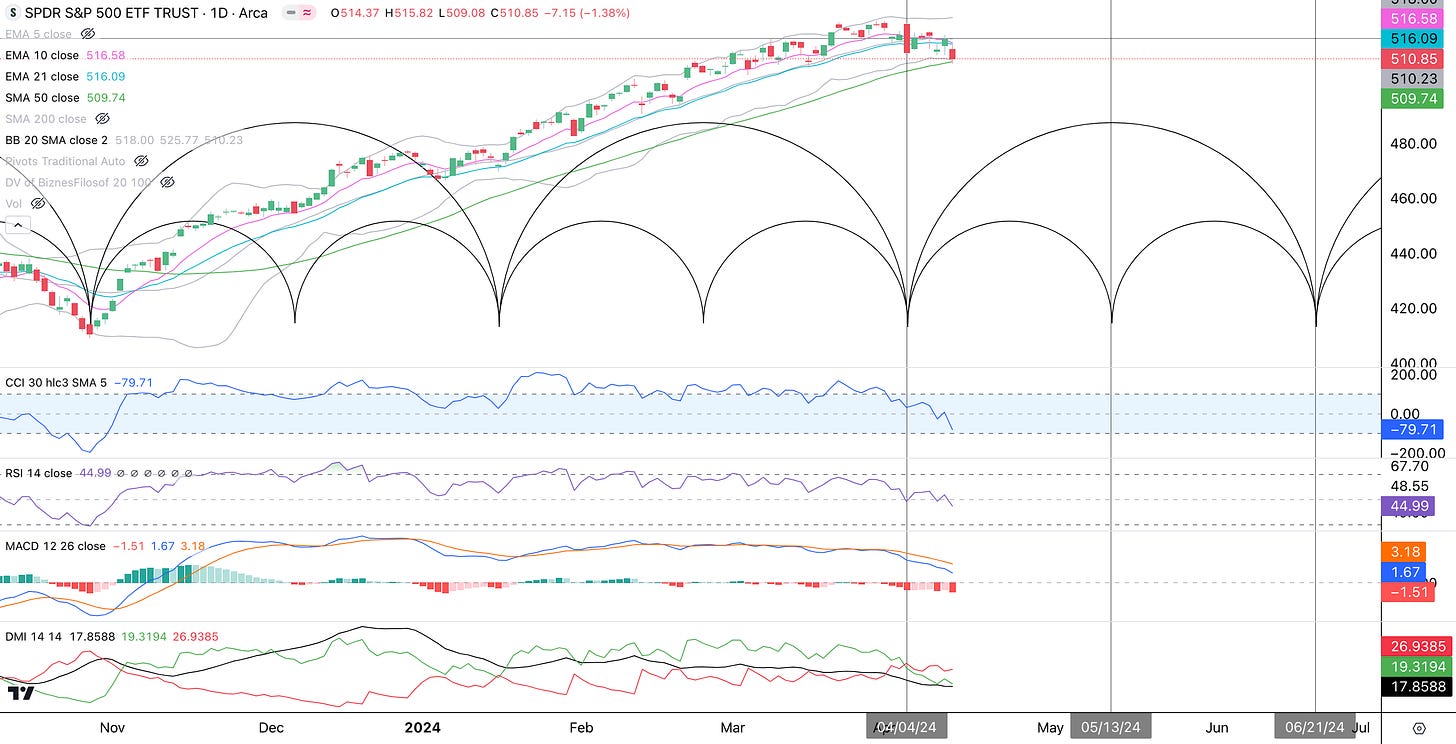
After 21 weeks of an uptrend following the late October low, it appears to be over as the S&P 500 (SPY) broke and held below the 21 EMA (blue line) and had two negative weeks in a row. The uptrend consisted of two 54-bar (trading day) cycle brackets and four 27-bar half-cycles. The cycle that began on April 4th appears to be a negative left-translated cycle and this could last until the next half-cycle that begins on May 14th or the next full cycle bracket which starts on June 21st. The CCI indicator, which works quite well with cycles, confirms that the uptrend is over for now as it fell below the 0 mark. The Relative Strength indicator shows a bearish divergence. The MACD indicator shows bearish momentum. Finally, the DMI indicator shows that we are in a bona fide downtrend now. As the SPY is sitting on the 50 SMA (green line) and Lower Bollinger Band (grey line) we may get a bounce next week, however, the SPY has to get above and trend above the 21 EMA to signal that a new uptrend has begun.
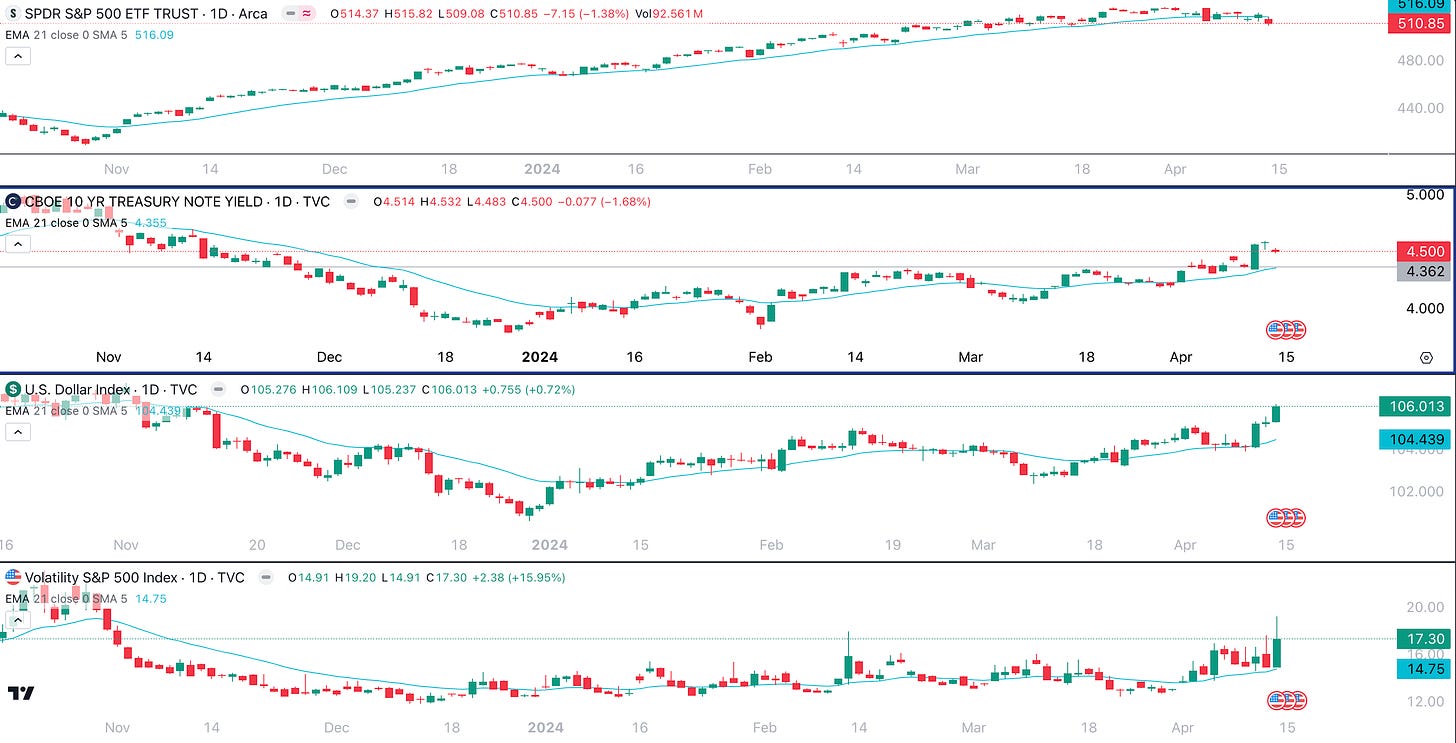
The Intermarket Picture shows a flight to safety. The US Dollar (DXY) spiked higher as the 10-year Treasury rate rose. This sounds like investors pulling money out of risk assets (equities) and into risk-free assets. The spike in the VIX could be the driver for this action as volatility increases and negative news takes root in the minds of investors.
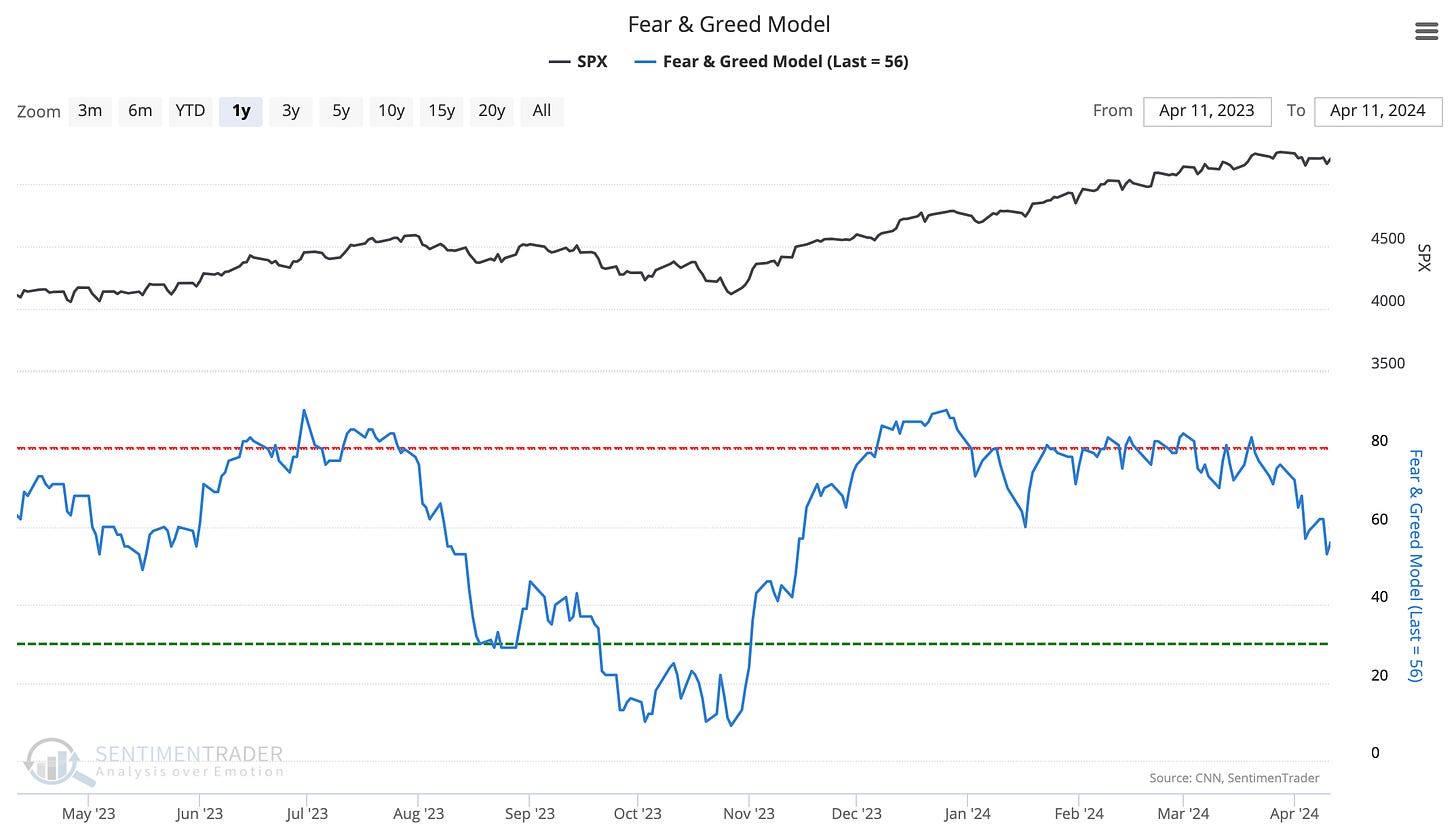
The Fear & Greed Model is now neutral but shows a trend of increasing fear.
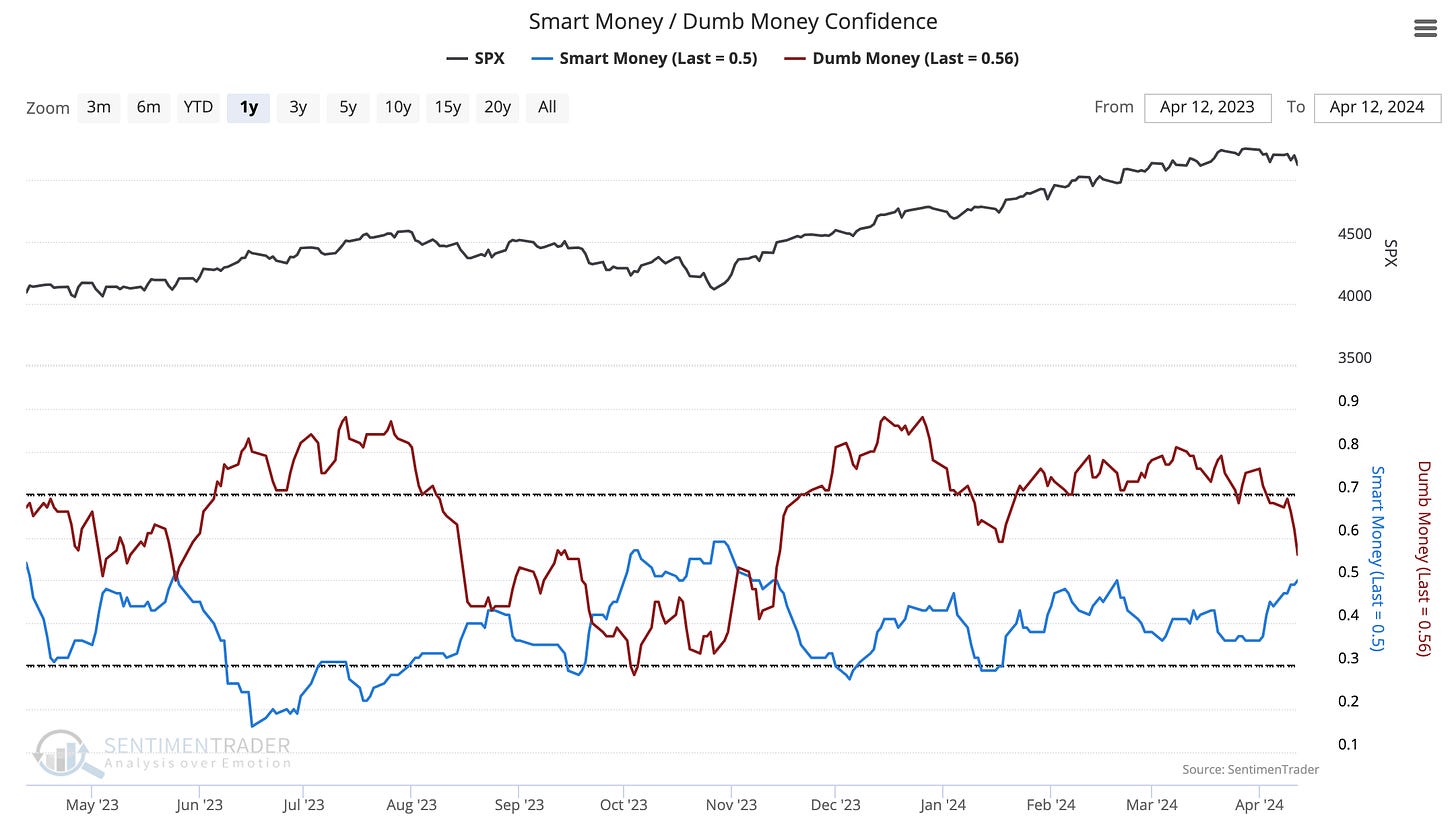
The Smart Money/Dumb Money Confidence indicator shows that as retail sells, smart money is buying.
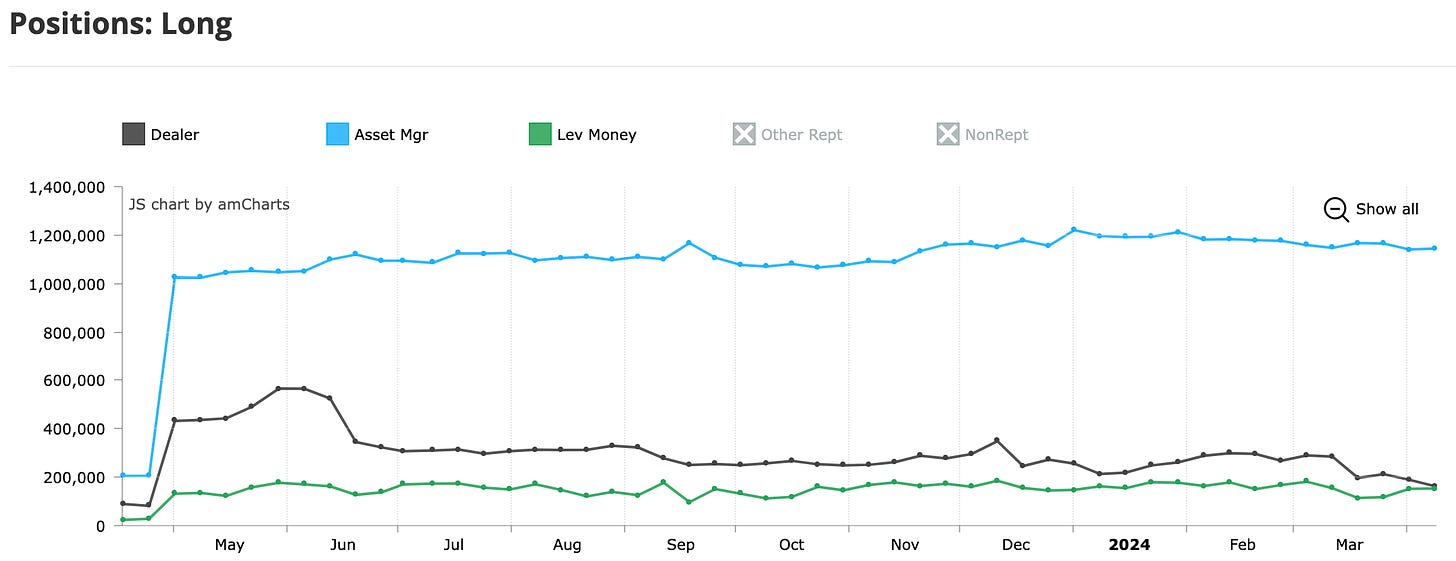
Looking at the COT Report for the S&P 500 we can see that Asset Managers are slowly adding equity exposure…
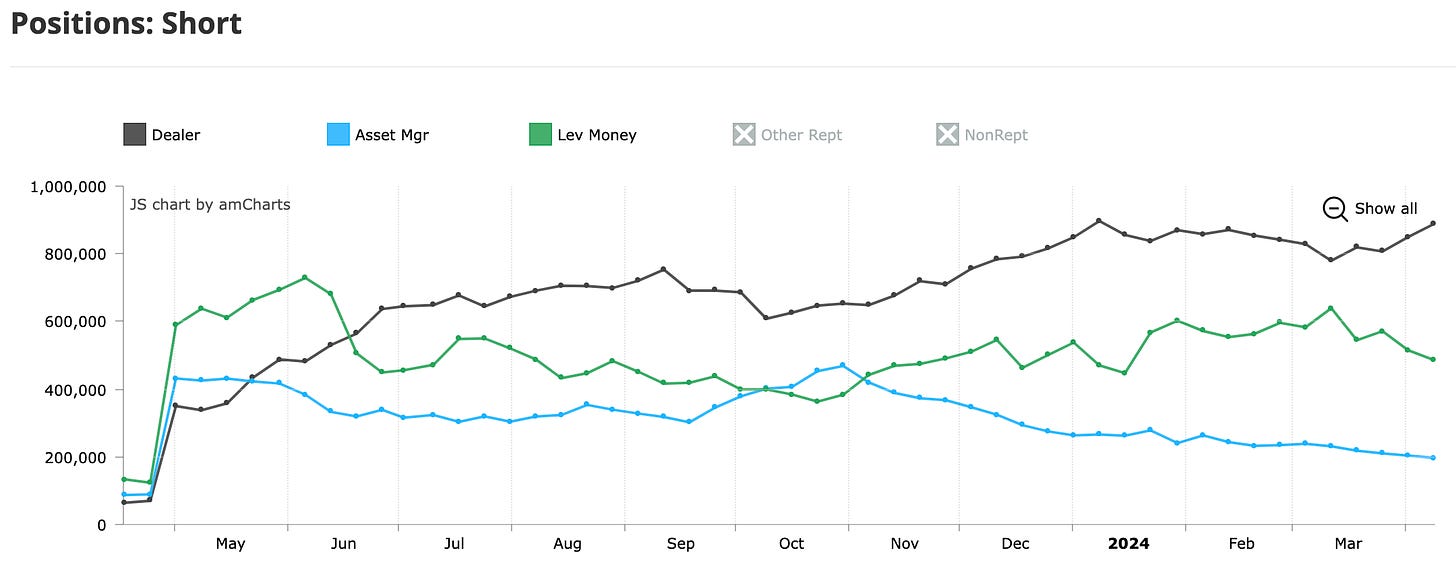
as Dealers (Market Makers) are accumulating a large short position. With a significant short position, Market Makers will seek to cover their short positions at lower prices in the short term.
So where do we go from here? In our Premium Section for Paid Subscribers, we’ll go over four different actionable strategies to Make Money on this pullback using: 1) the 2-hour chart, 2) Fibonacci Retracements, 3) the Yearly and Intermediate Cycles, and 4) our proprietary Energy and Long Cycle Forecasts.
We just released our Q2 2024 Cycles Forecast (on https://cyclesedge.com/) for multiple different asset classes and equity names. The introductory article for the quarterly Cycles Forecast can be found here. Please note that our Founding Members have now been emailed these Cycles Forecasts (the full deck covering every name!). If you would like your copy earlier for the next quarter, please consider upgrading to a Founding Member status on our Substack.
Disclaimer - All materials, information, and ideas from Cycles Edge are for educational purposes only and should not be considered Financial Advice. This blog may document actions done by the owners/writers of this blog, thus it should be assumed that positions are likely taken. If this is an issue, please discontinue reading. Cycles Edge takes no responsibility for possible losses, as markets can be volatile and unpredictable, leading to constantly changing opinions or forecasts.


