The "Washing Machine" Market Environment
Should We Buy Utilities For Protection?

We’re offering 15% off our Cycle Forecasts, making this an ideal time to use cycle-driven insights to guide your investment decisions for the rest of the year. Check it out here: https://cyclesedge.com/
Up…down…up…down… this is the type of market environment that we like to call the “Washing Machine” market.
First, let’s take a look at 4 key indicators to understand where the market probabilities stand right now.
Indicator 1: The Nasdaq HiLo Logic Index
The original HiLo Logic Index was created by Norman Fosback in 1979.
It intended to observe “split” market conditions by looking for periods when there are BOTH a large number of 52-week highs AND 52-week lows among exchange-listed securities.
When there are many of both, the market is severely split between winners and losers, which tends to be negative for stocks.
When the number is very low, the market is heavily one-sided, which tends to be positive for stocks.
The chart below highlights all dates when the 10-day average of the Nasdaq HiLo Logic Index crossed above 3.
As you can see, this happens very infrequently, with the most recent signal on February 2nd.

The table below summarizes subsequent Nasdaq 100 Index performance.
The critical point is that the Win Rates and Median Returns are far below average, suggesting that some sort of market trouble is likely to unfold.
Viewed in isolation, the recent signal from this indicator suggests that investors should adjust their market expectations in the months ahead.

Indicator 2:The Nasdaq Titanicburg Indicator
The NASDAQ Titanicburg is a composite indicator that combines the NASDAQ Titanic Syndrome and the NASDAQ Hindenburg Omen.
Each of these indicators looks for a specific pattern in market action versus new high and new low activity to identify potential underlying weakness in the market.
Higher readings on the NASDAQ Titanicburg signal unfavorable market conditions, while lower values are considered more favorable.
The key thing to watch for is a dramatic spike in the indicator value.
The chart below highlights those dates when the indicator rose above 40.

The table below summarizes subsequent Nasdaq 100 Index performance.
A random Hindenburg Omen signal or occasional Titanic Syndrome signal is not typically a reason to worry.
However, when they accumulate, it generally indicates serious deterioration in market breadth - a spike in the Nasdaq Titanicburg indicator normally reveals this type of action.
Despite a few recent Nasdaq Hindenburg Omen signals, this indicator is still far from issuing a warning.
Nevertheless, with the number of stocks making new highs and lows on the rise lately, investors should check the Nasdaq Titanicburg indicator at least once a week for any warning signs of trouble.

In the next section, we’ll look at 2 additional market indicators with their backtests.
Then, we’ll cover the Utilities sector in-depth, given that it’s been showing a lot of relative strength during this shaky period for the broader markets.
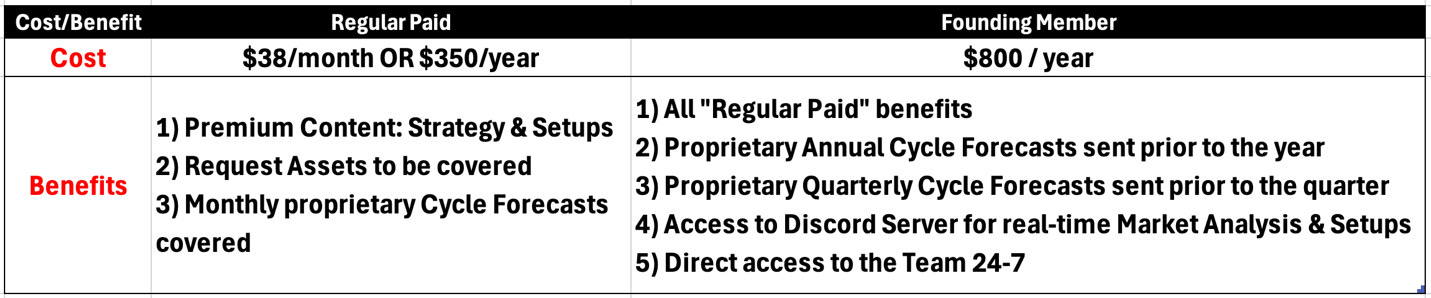
Find our membership cost/benefits below.
If you’re serious about Making Money (our primary goal at Cycles Edge), then the Premium Sections are key for you!