We have been expecting a 4-Year Cycle decline to occur from the Summer high to November 2024. We mentioned that the July 16th high was probably the Summer high and in the same article we provided four different cycle warnings, which you could read here. A nasty market decline from the 4-Year Cycle crest is the “what” that we are expecting, and that appears to be materializing. Let’s look into the “how”…as in how the market decline could unravel.
No More Free Lunch: USD/JPY Carry Trade Unwinding
Who say’s there is no free lunch in the world? For a while Japan had a negative interest rate policy which was quite a good free lunch. Traders took advantage of this by selling the Japanese Yen or borrowing Japanese debt to buy other risk assets like the S&P 500, the Nasdaq 100 and hot Artificial Intelligence stocks! What a great carry trade!
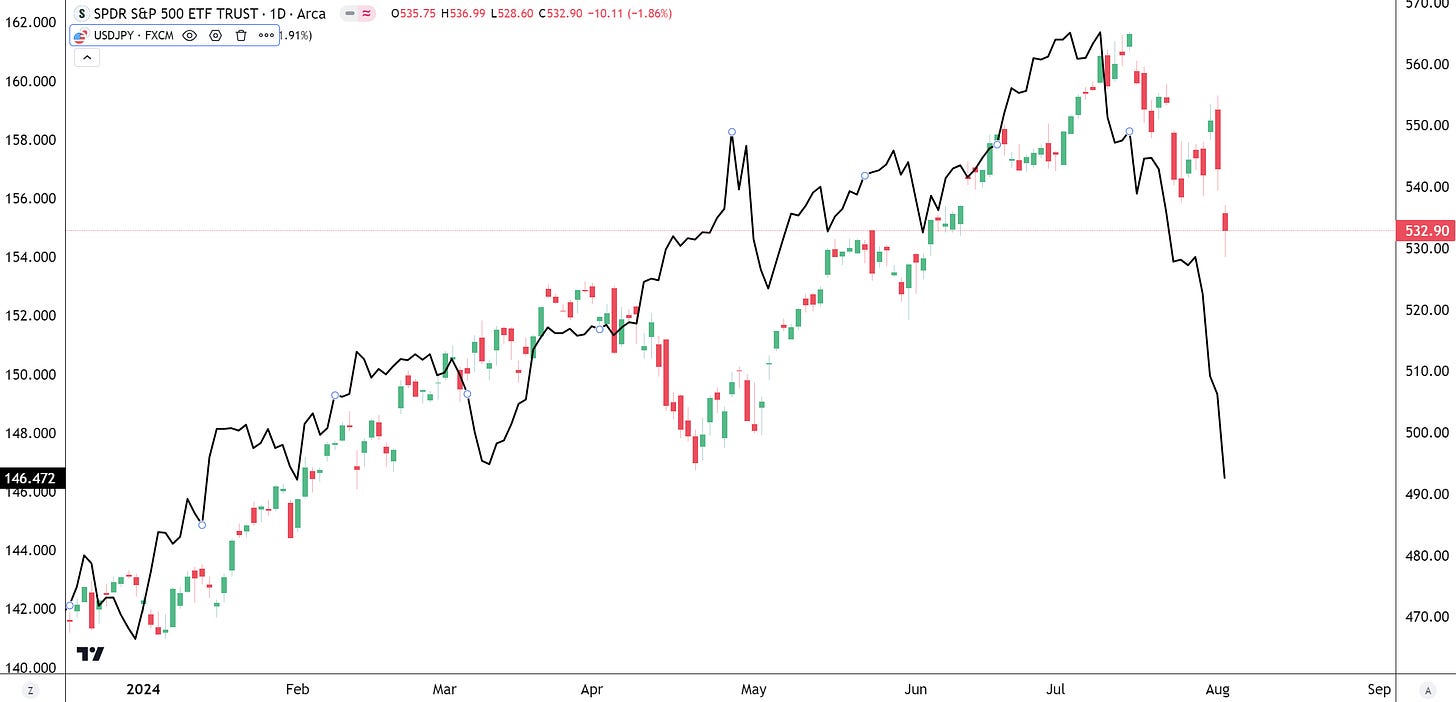
Unfortunately that free lunch did not last forever and the day of reckoning is happening now. The Bank of Japan is doing away with their negative interest rate policy and they began raising interest rates. This caused a spike in the Japanese Yen, or a plunge in the USD/JPY and a concurrent liquidation in risk assets (SPY, QQQ, etc.). Notice in the chart below how correlated the drop in the SPY (candlesticks) is with the drop in the USD/JPY (black line) currency pair. All risk assets appear to be negatively affected and even the recent rotation into Small Caps and Value stocks reversed sharply.
This may be the most important Intermarket dynamic until the end of the year and we will share our cycle forecast for the USD/JPY in the Premium Section.
Breadth & Rotation Fake-Out
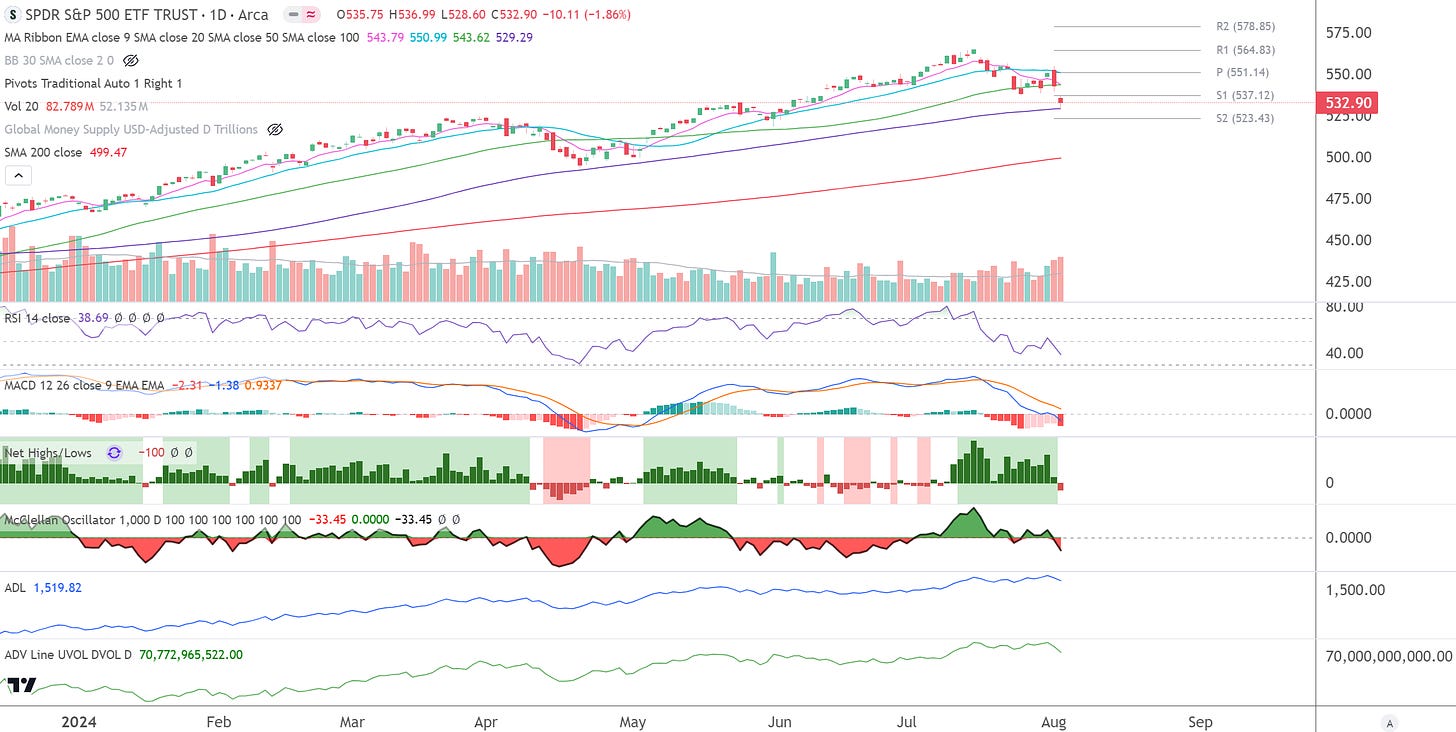
The S&P 500 (SPY) was down 2.12% for the week, but more importantly down 1.86% on Friday alone. Friday was a negative expectation breaker as everyone expected the post FOMC rally to continue. The SPY is in a bona fide downtrend, trending below the 9 EMA (pink) and 20 SMA (blue). The decline did pause near the 100 SMA (purple), but there is no guarantee that this SMA will hold as support since the RSI is not yet oversold and the MACD is showing strong downside momentum. The S2 Pivot Point at $523 is the next level of support if the 100 SMA breaks. Also notice on the chart below that:
The high levels of Net New Highs evaporated quickly to Net New Lows. This makes us believe that the recent breadth expansion was a fake-out.
The McClellan Breadth Oscillator also turned negative below the 0 mark.
The Advance/Decline Line (ADL) and Advance/Decline Volume Lone (ADV) both turned down last week.
The recent selloff occurred on heavy volume.
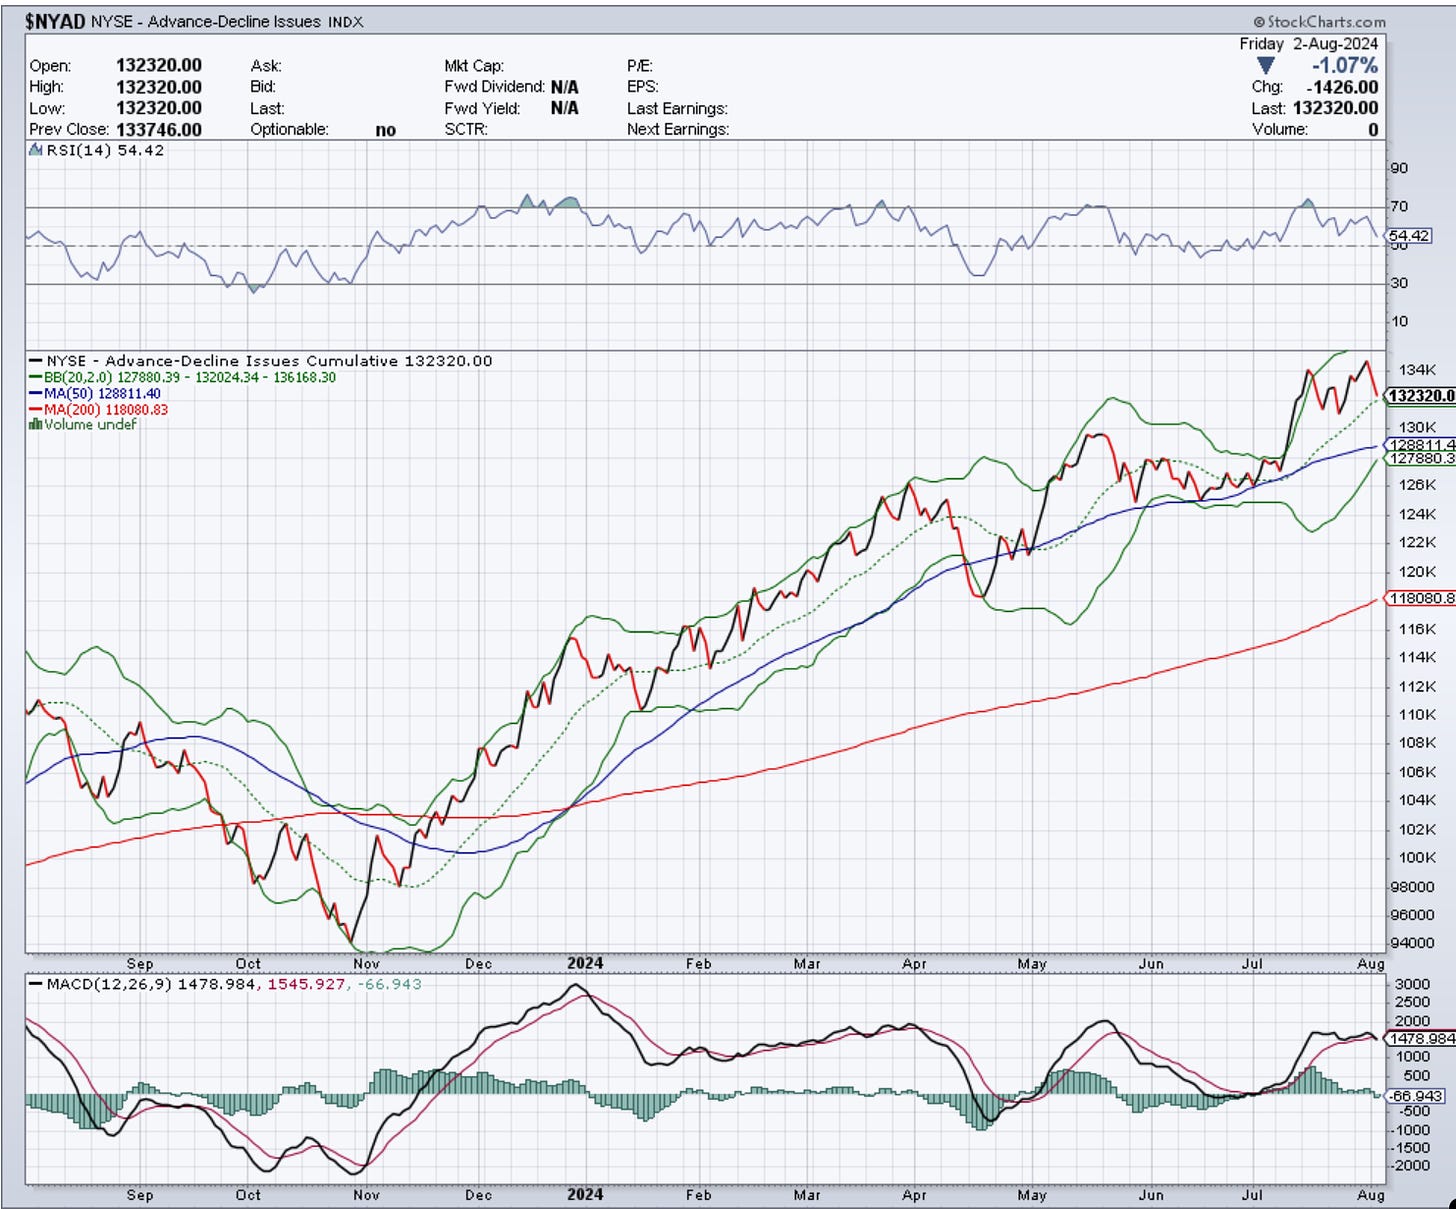
Taking a closer look at the NYSE Advance/Decline Line we notice that it fell and has a bearish RSI divergence. Meanwhile the MACD just made a bearish crossover as the MACD Histogram turned negative. This hints to us that the downtrend in breadth could be just beginning.
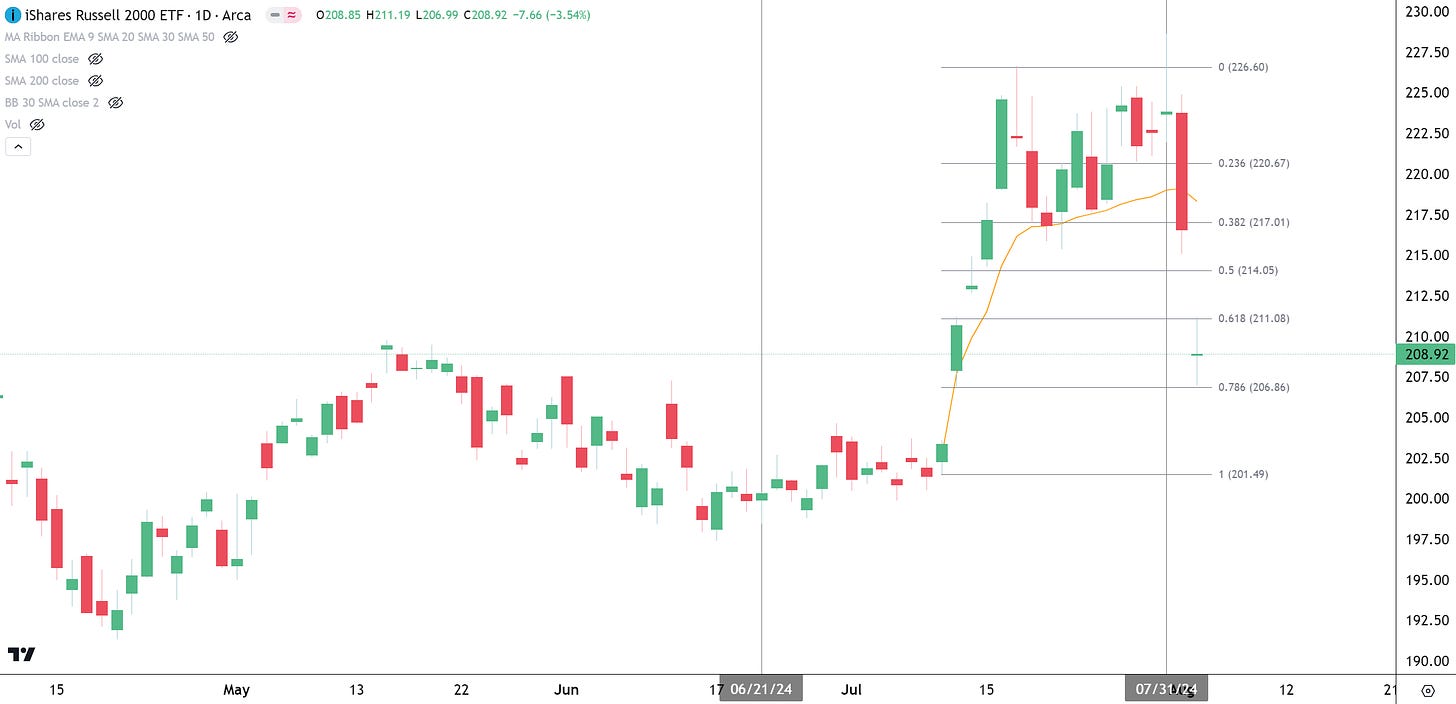
But what about the rotation into Small Caps? Well, that fizzled out pretty badly. IWM is now at $209 and using an Anchored Volume Weighted Average Price (AVWAP) from the start of the recent uptrend (orange line), we could see that the average buyer is now underwater or at a loss. On the bright side IWM appears to have stopped declining at the 78% Fibonacci Retracement so there is the chance of a bounce. However the 78% retracement is known as a weak retracement that shows a lack of strength. A bounce is possible, but new highs are not probable.
An “Oh-No” Rug-Pull Moment
Now for the bombs that have yet to go off.


