Things Just Changed
Premium Section: Finding Trend Trades and Oscillation Trades on SPY, QQQ, IWM, and TLT
Last week on Monday we had a global flash crash driven by the unwind of the Japanese Yen Carry Trade. However for the rest of the week markets recovered, as Central Banks used liquidity to stabilize financial markets. Nonetheless many things have changed that we need to be mindful of going forward. In the Free Section we’ll discuss the major changes and in the Premium Section we’ll go over finding Trend Trades and Oscillation Trades on the SPY, QQQ, IWM and TLT in this market.
Change #1: Downtrends Are Not Your Typical Buy-the-Dip Market
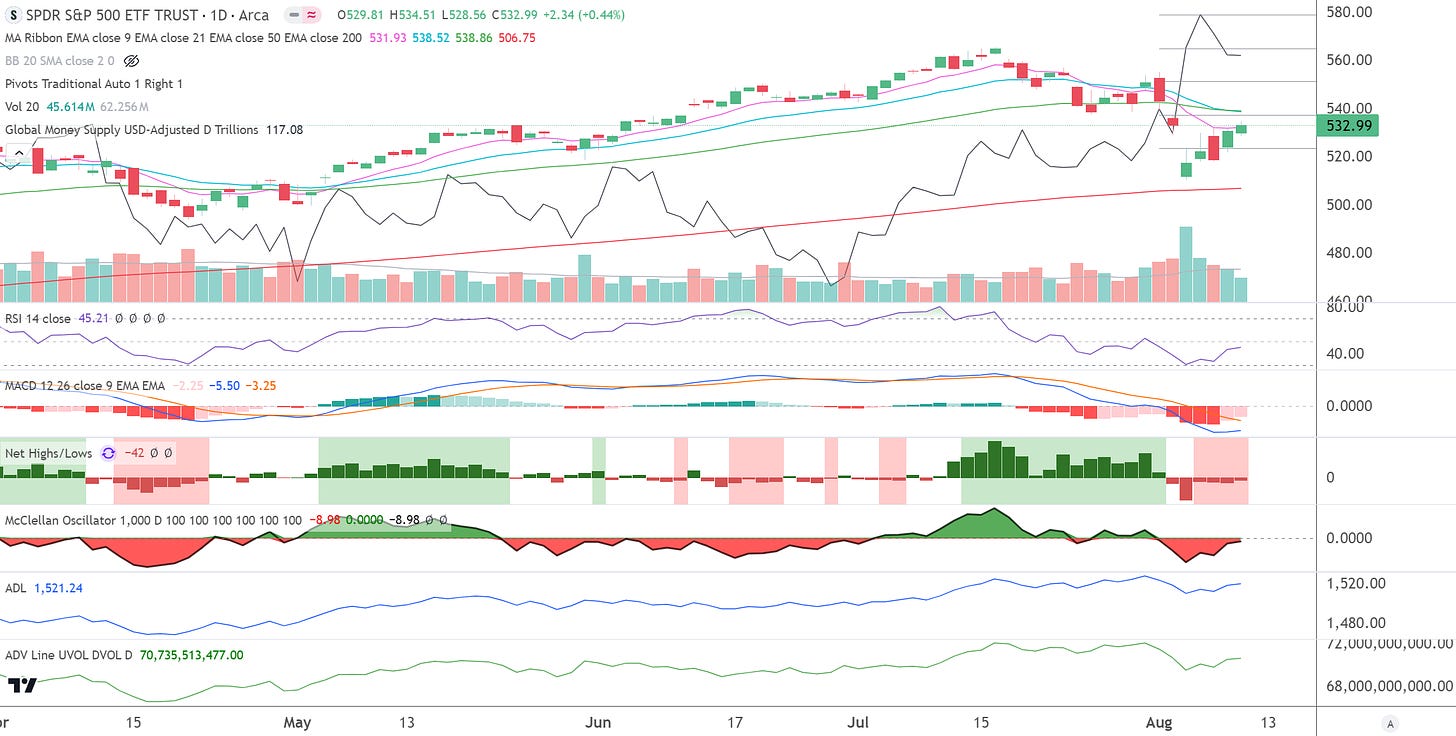
The chart below shows how Global Money Supply (Central Bank Liquidity in black) stepped in to support markets last week to stop a crash that was happening. The S&P 500 was down over 4% on Monday but recovered and even filled the gap by Friday. Despite the fact that the market recovered does not change the fact that there was significant technical damage done and now we are in a downtrend now below the 21 EMA. The SPY has to prove to us that it can get above and stay above the 21 EMA (blue) for a new uptrend to be confirmed.
Here are a couple of items to take note of:
The SPY retraced back to the 9 EMA, which is typical. The 9 EMA works as a magnet and price usually retouches the 9 EMA.
RSI is still below 50, so there is no strength in the up move, hinting that the up-move on Tuesday to Friday was countertrend action, not impulsive action. The impulsive action may still be on the downside.
MACD is below 0, as there are Net New Lows. Definitely not a Swing Trader’s Market or a typical Buy-the-Dip Market.
The McClellan Breadth Oscillator did recover from crash levels, but it still below 0. Not a sign of strength.
The Advance Decline Line (ADL) and Advance Decline Volume Line (ADV) dropped hard on Monday and made timid recoveries for the rest of the week. Another factor that supports our thought that the impulsive move is to the downside as the countertrend or corrective move is to the upside. In other words, there is a high chance the downside is not over.
Change #2: The Recession-Focused Paradigm
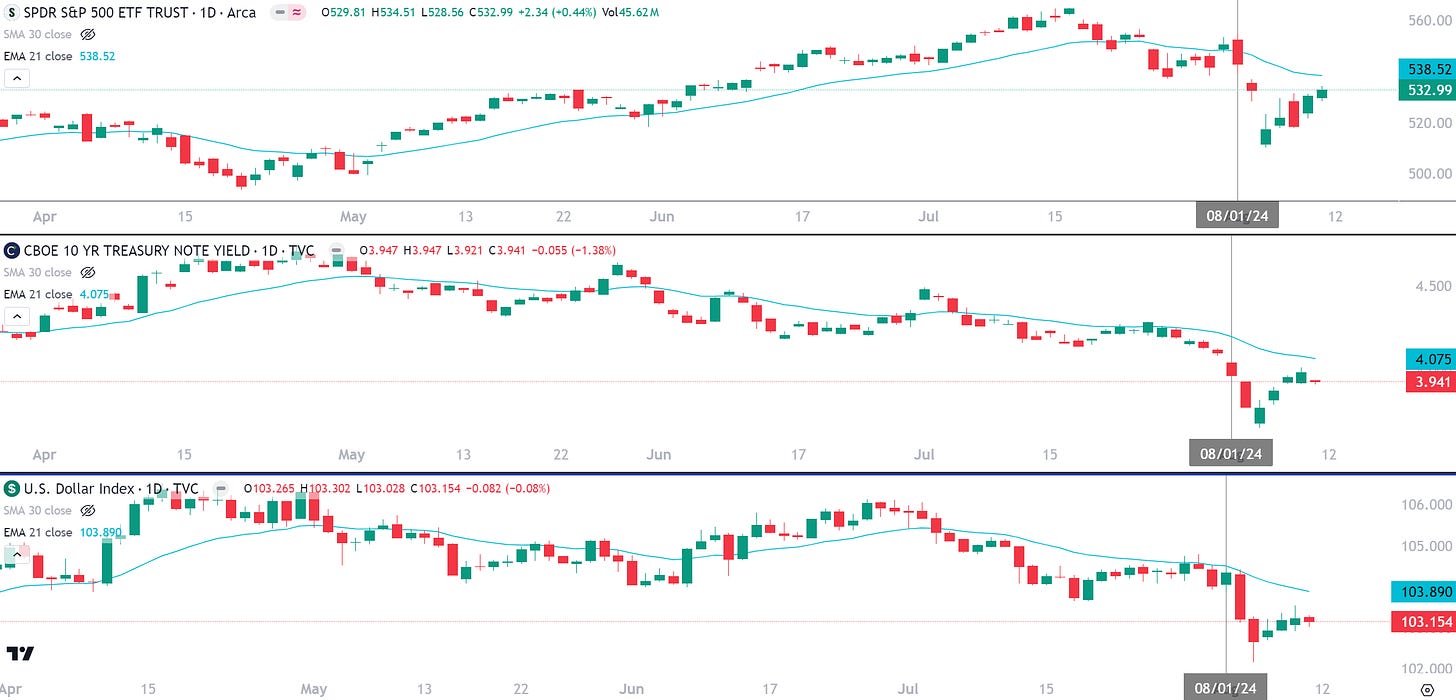
We were in an Inflation-Focused Paradigm since 2022. Under this paradigm, the stock market would rise as interest rates (TNX) fell and the US Dollar (DXY) fell. A falling TNX foreshadowed increased odds of a Fed rate cut, while a falling DXY meant investors were getting out of cash and buying risk assets.
In August 2024 it changed into a Recession-Focused Paradigm. Now it appears that the stock market rises when the TNX rises and the DXY rises. The rising TNX hints that an emergency Fed rate cut is not needed…meaning the economy is strong and not in need of emergency help. The rising DXY hints that damage from the Japanese Yen Carry Trade is over. However…
Change #3: Japanese Yen Carry Trade Not Over Yet
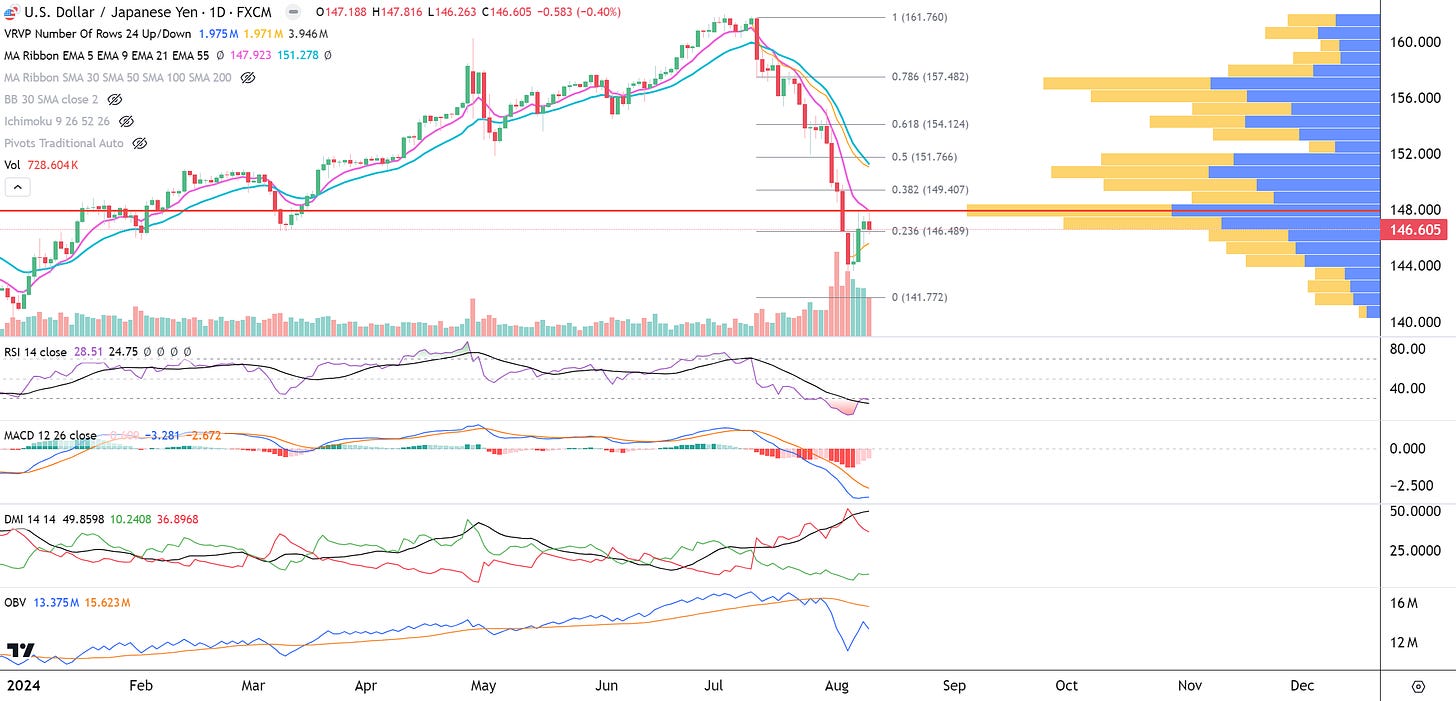
…Research departments at Investment Banks believe that the JPY Carry Trade is 2/3 to 3/4 done. If their research is correct then perhaps another leg of the JPY Carry Trade drop is needed to completely wash out the trade.
Looking at the chart of the USD/JPY the carry trade does not appear to be over. Last week’s retracement of the USD/JPY drop was very weak and looks like a bear flag setting up for another leg down. A 23% Fibonacci Retracement tells us that the downside pressure is still strong, and furthermore the USD/JPY found resistance at the 9 EMA. Odds are supporting another leg down.
Change #4: Long Term Buyers Get Nervous
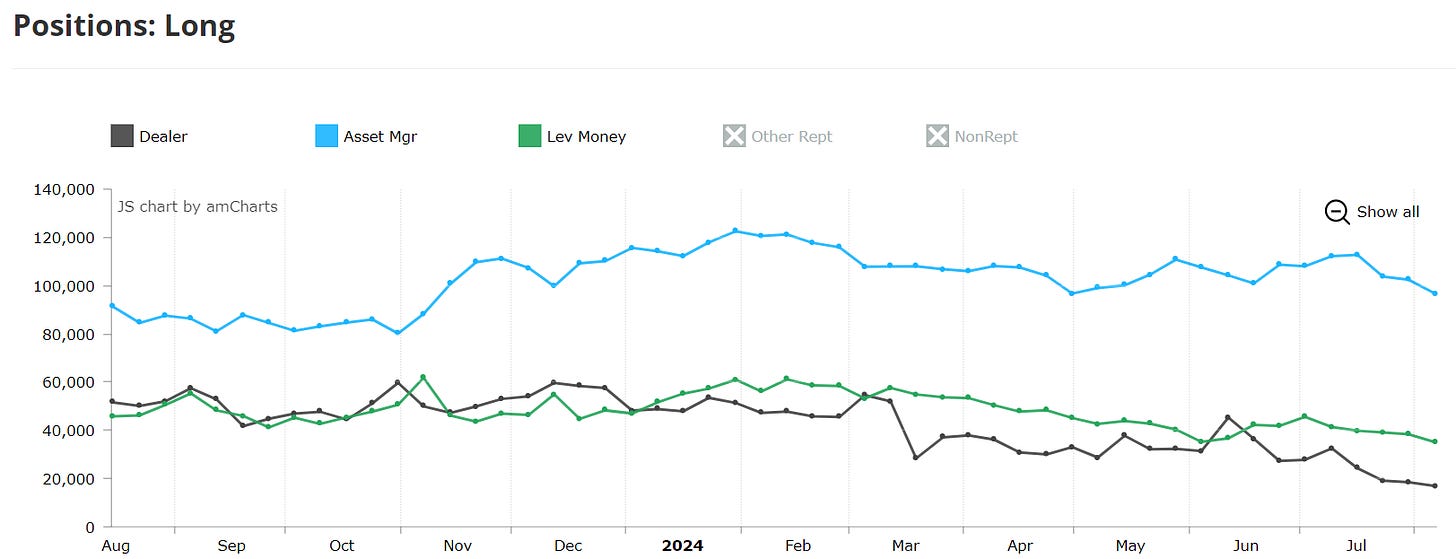
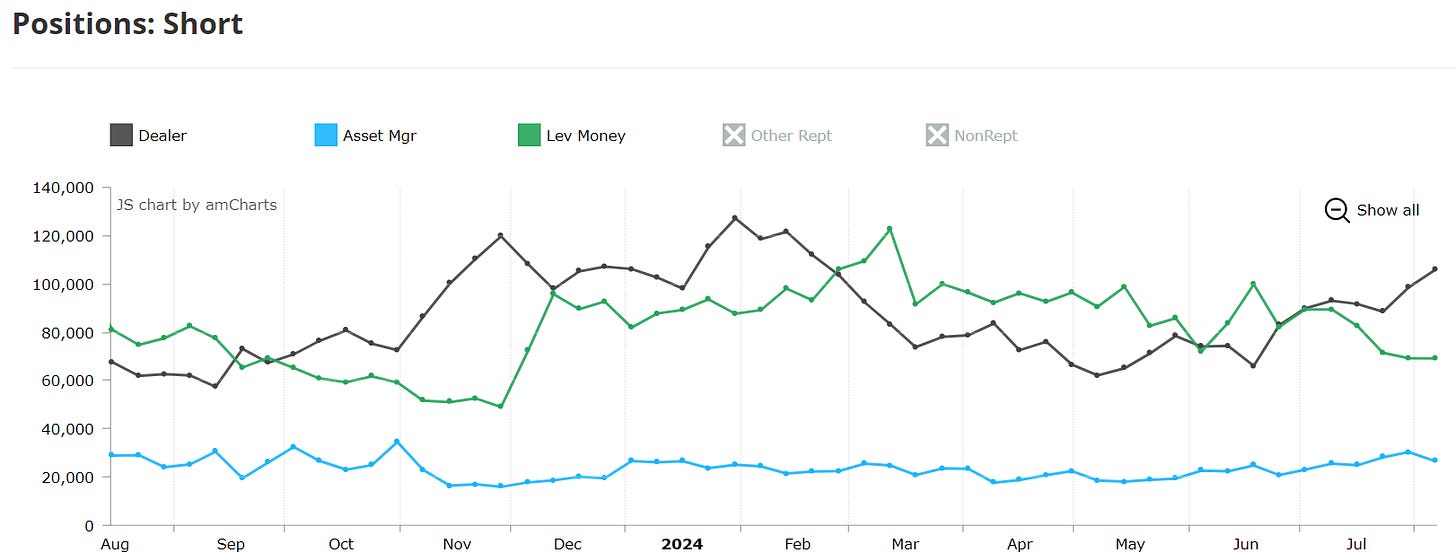
Long-term buyers or the “strong hands” may be cashing out like Warren Buffet who is raising cash. The Commitment of Traders Report for the Nasdaq 100 shows that Asset Managers (blue) are dumping long exposure.
Meanwhile Market Makers are building a significant short position.
This combination favors another leg down in the market after they trap enough bulls that were too early and too eager.
Change #5: Impulse vs. Countertrend Movement
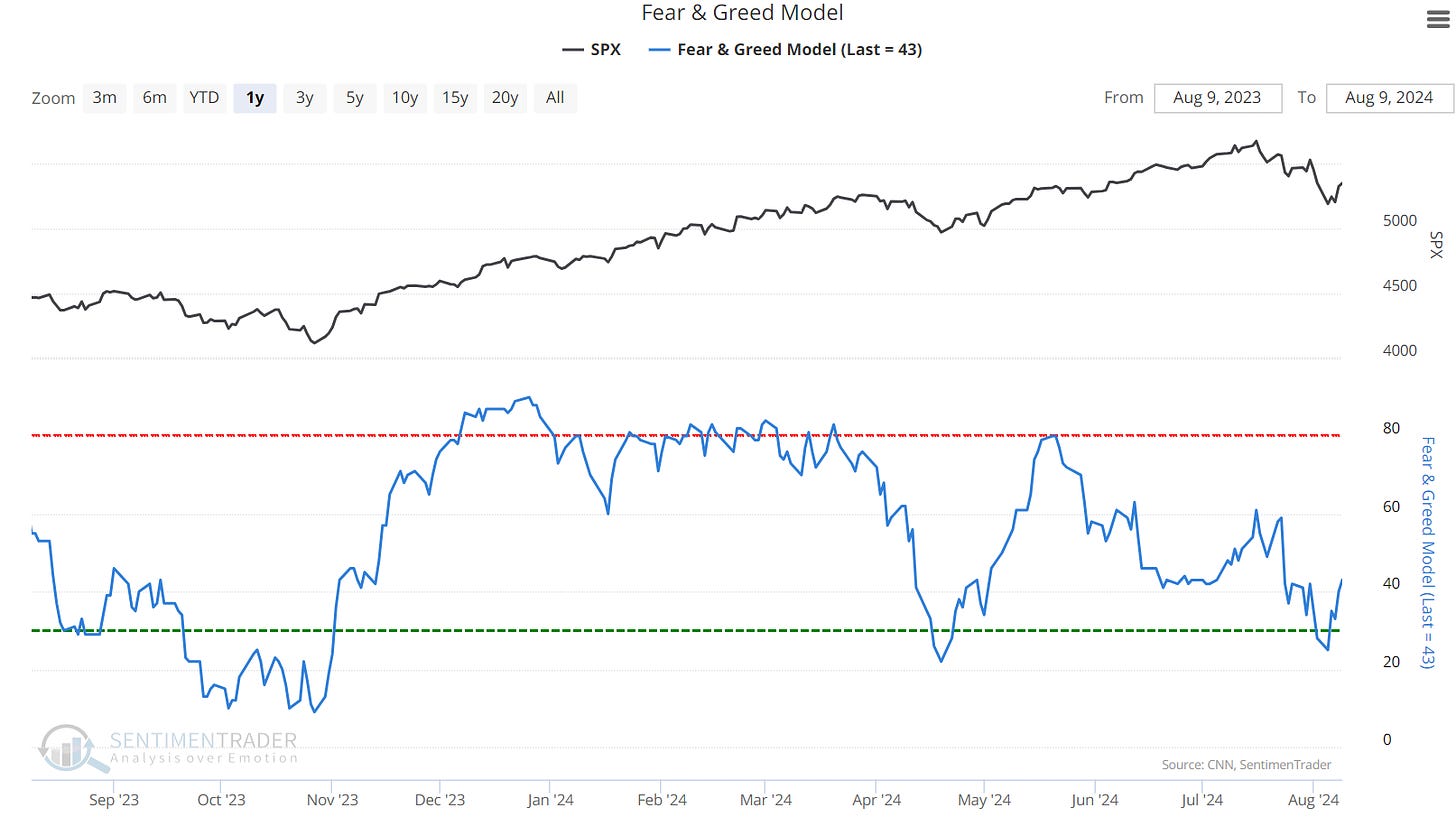
The Fear & Greed Model appear to be at a buy point where extreme fear is statring to turn.
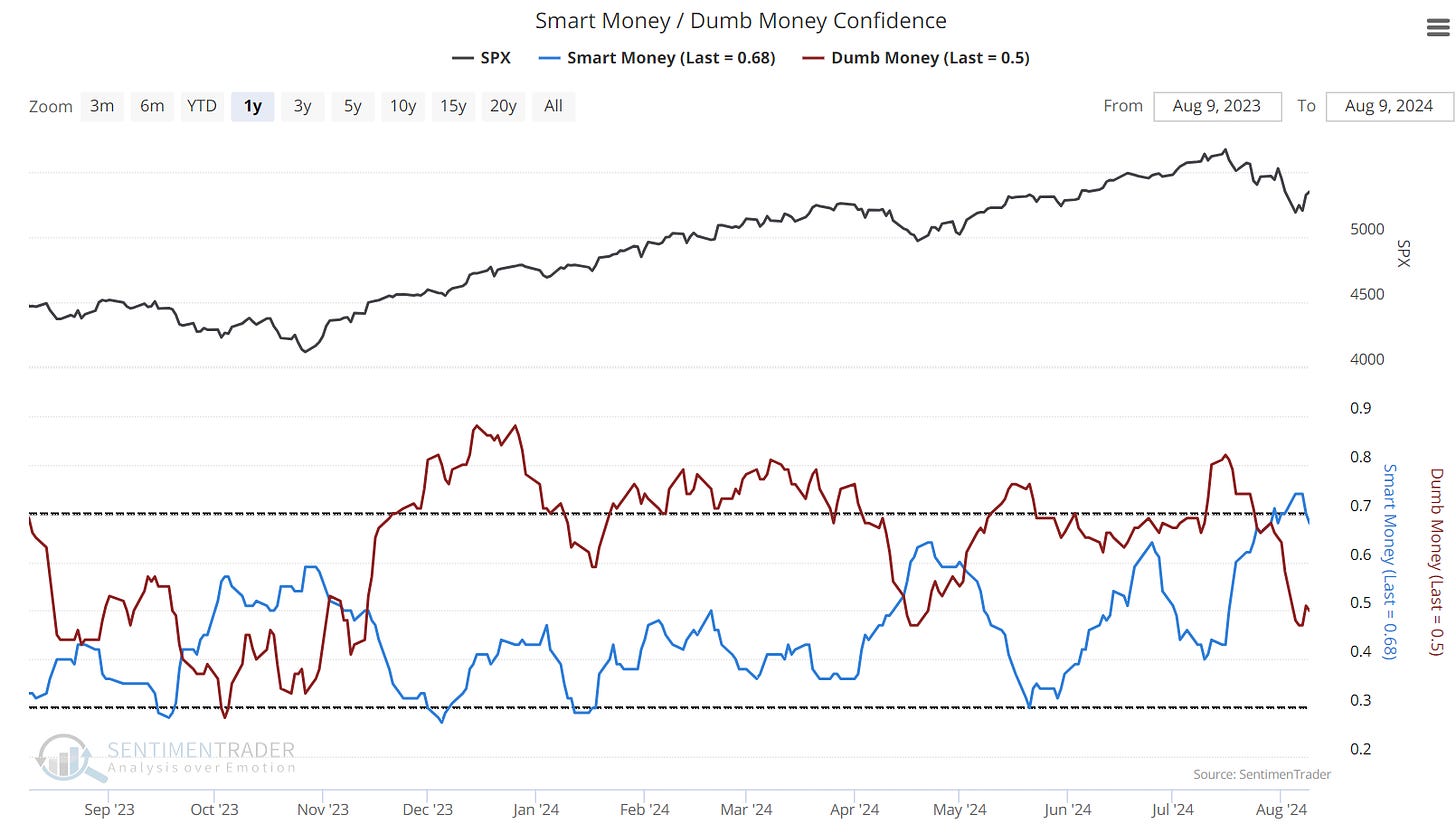
Smart Money positioning is very high as they bought the dip.
Financial Advisors and Professional Money Managers are reducing equity exposure and feel less confident about the market.
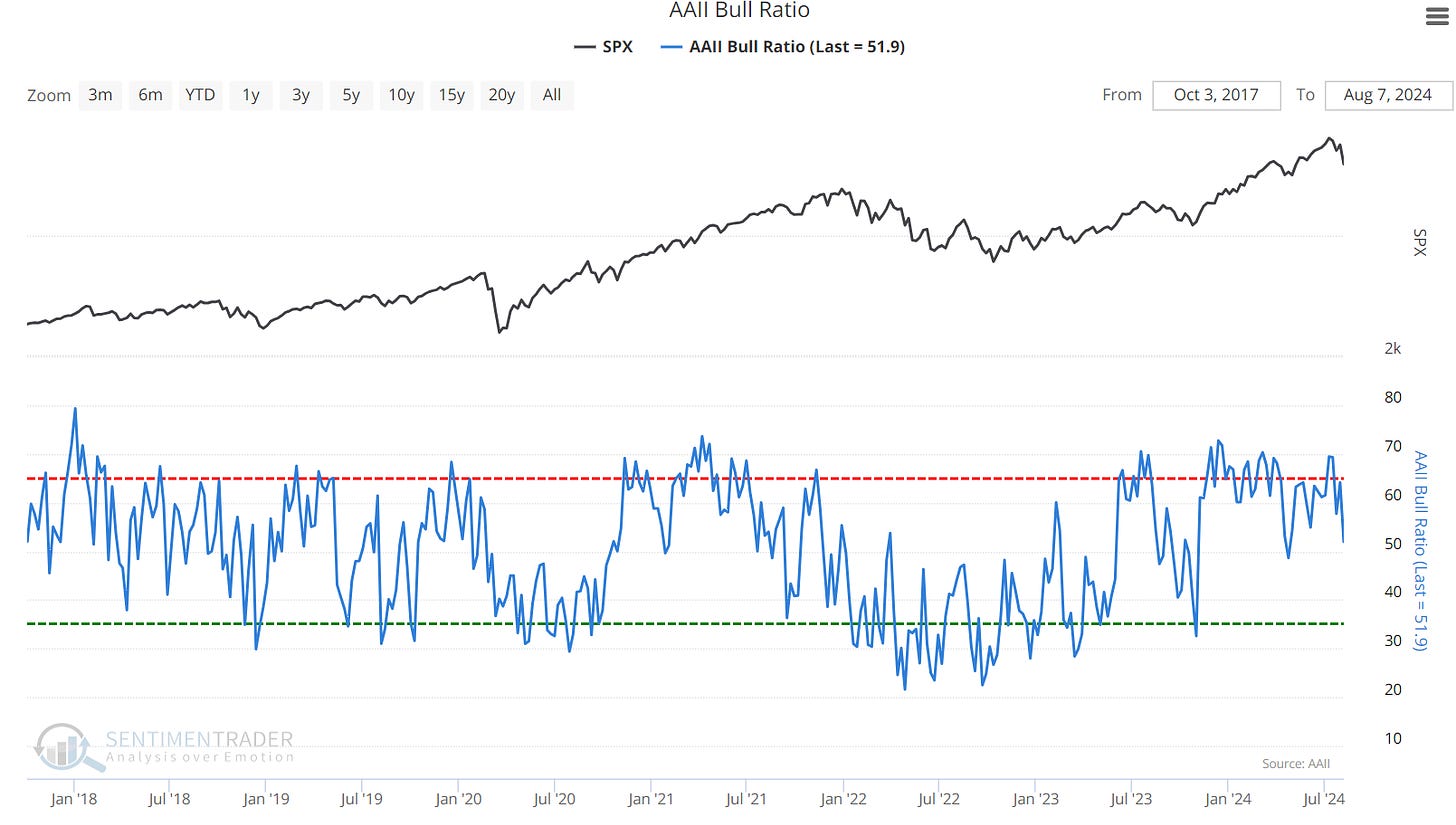
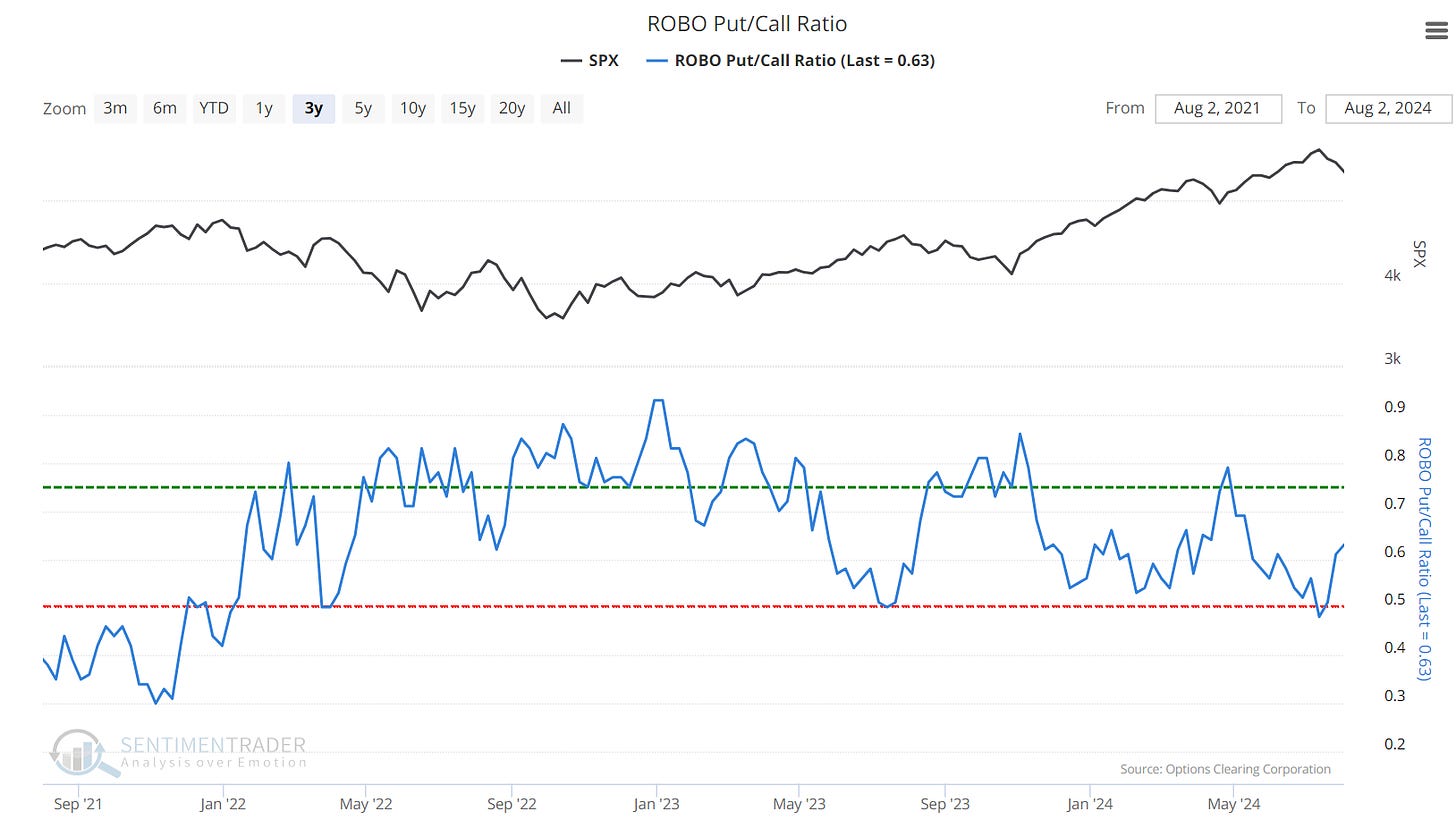
There are still a lot of retail calls in the market that need to get washed out (downward pressure on the market). Retail buys calls and the market goes down so they don’t get paid. This is a very routine dynamic.
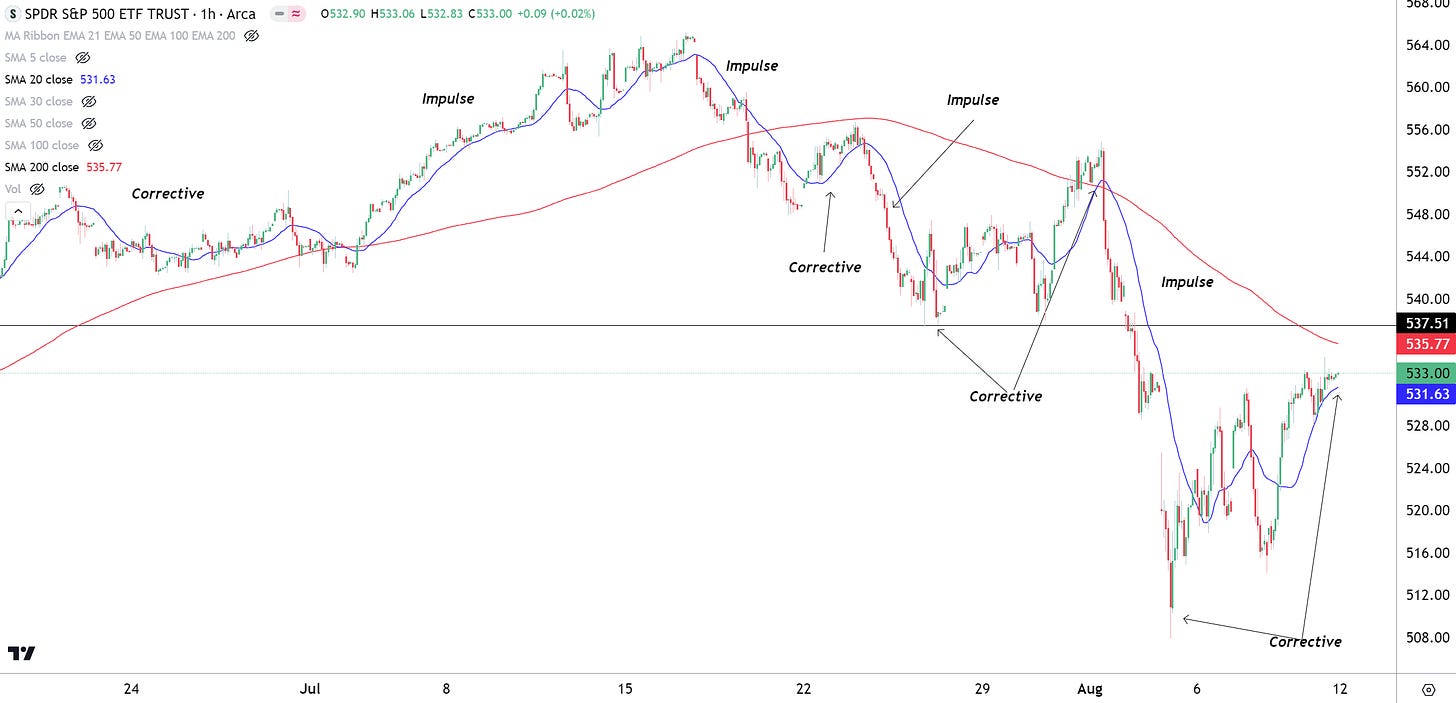
So do we go up or down? Let’s look to price action for clues. Looking at the SPY on the 1 Hour chart we can see the difference between Impulsive price action and corrective price action. Starting in the middle of July the Impulsive price action turned to the downside and up movements became corrective. This puts the odds in favor of more downside in the near future. A break above then reverse below the declining 200 SMA (red) on the hourly chart seems like a possibility. There is also strong resistance at $538.
Next week is a heavy economic data week with Producer Price Index (PPI) on Tuesday, Consumer Price Index (CPI) on Wednesday, Retail Sales on Thursday and Consumer Confidence on Friday. This provides plenty of catalysts for volatility.
Further downside after some corrective bullish action fits with our cycle forecast for the VIX and SPY:


