Bitcoin
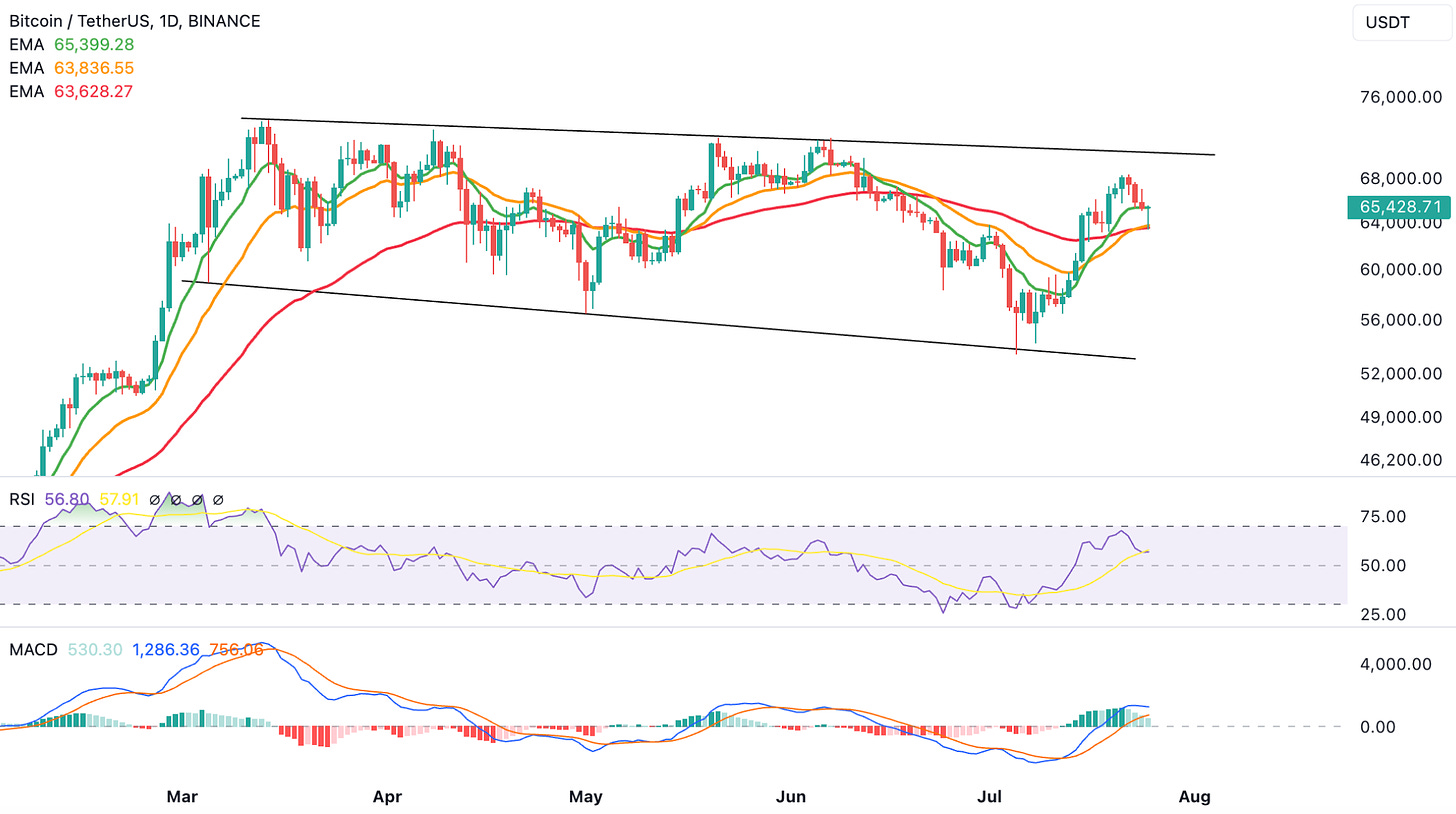
After an incredible +25% rally in just 16 days, Bitcoin has been seeing a slight pullback in the last few days (alongside the broader market). In fact, in the last 4 days, Bitcoin is down less than 5%, whereas, the Nasdaq 100 is down over 5%. This usually implies that when markets catch a bid, Bitcoin is very likely to catch a pretty aggressive bid.
In the last 4 days, Bitcoin has basically come down to retest its 21 and 55-daily EMAs and is now trying to reclaim the 9-daily EMA. The RSI and MACD are far from oversold, so there’s enough fuel to reach the resistance around $70.5k.
The real question is: Does Bitcoin have enough fuel to break past this resistance? That might require some more consolidation, but we do think that enough time capitulation has occurred to finally break past and make new ATHs.
Ethereum
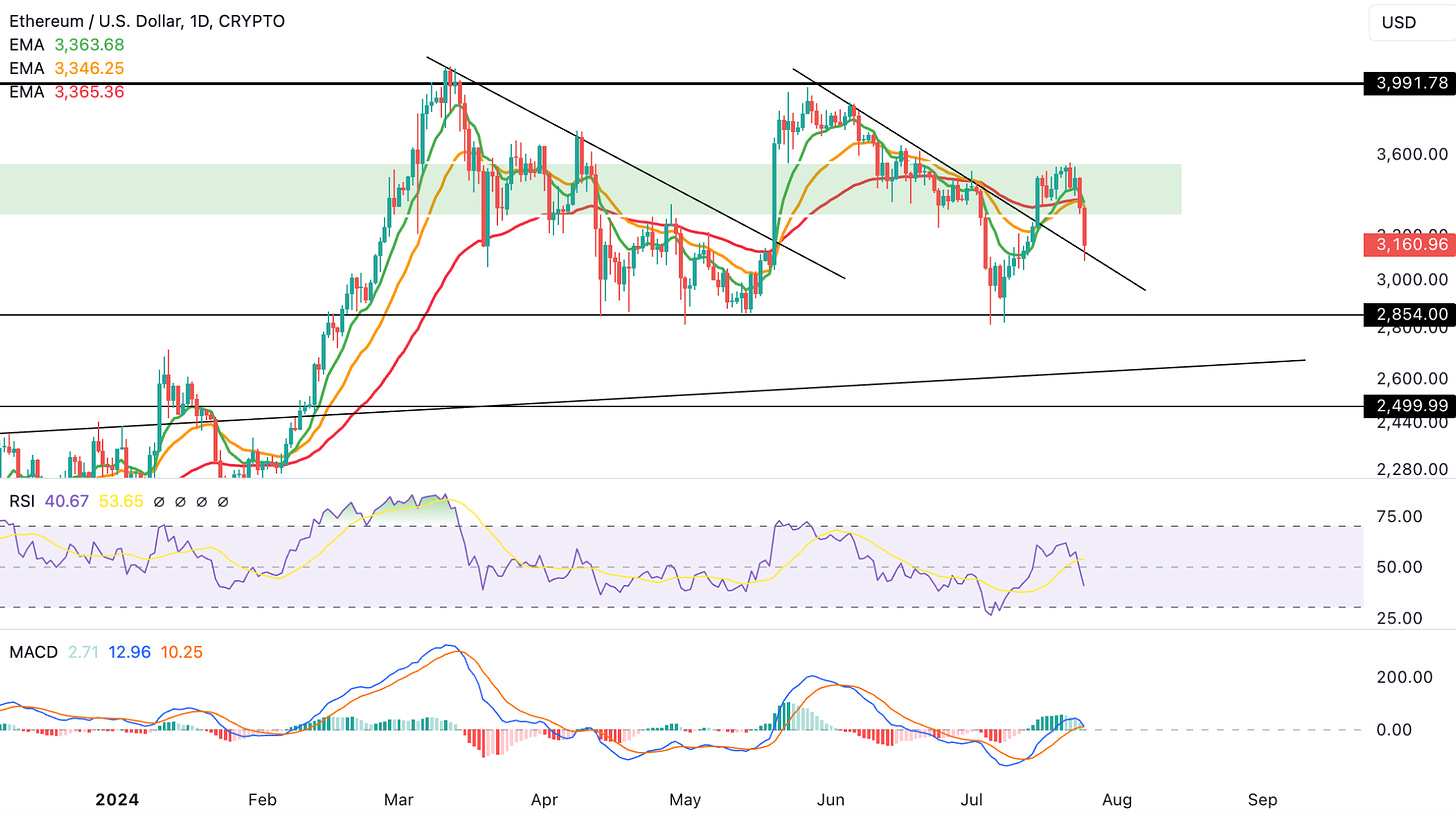
Ethereum has seen a sharped pullback than Bitcoin after failing to move above its support zone between $3300 and $3550 (highlighted in green below). The recent pullback has ended up retesting the earlier downtrend line.
If this holds at support, it could be a textbook case of a breakout above a downtrend line + retest. If that is the case then the next move should be able to get past the green zone and attempt the $3991 resistance level next.
Now even the ETH ETF is up and live, which should help with more capital inflow as well. However, a break below the downward sloping line would see the $2854 support level back in play (not our base case).
On-Chain Analysis
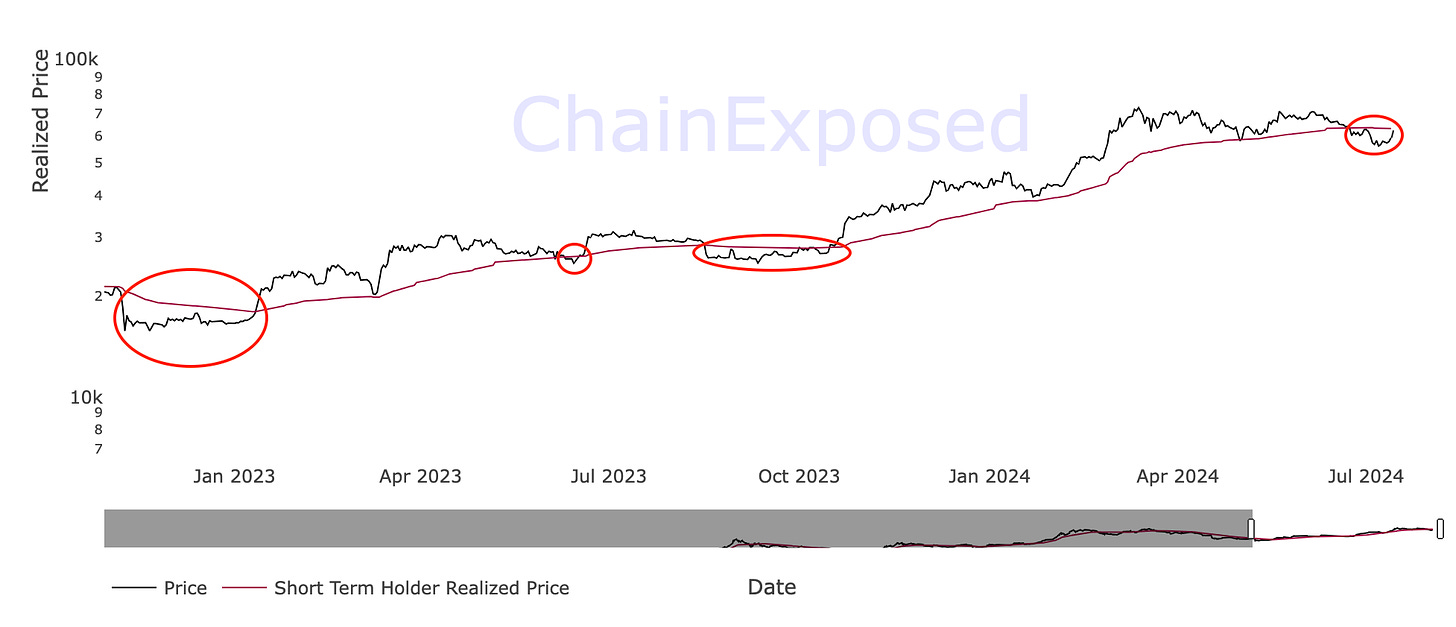
For the last 1 month, Bitcoin is below its short term holder realized price. This metric represents the average acquisition price of Bitcoin for investors who are considered short-term holders (those who hold Bitcoin for less than 155 days).
When price moves below this metric in bull markets, especially in this cycle, it has presented investors with a very profitable buying opportunity. We believe this time is no different.
In the next section (for Paid Members), we’re going to show you why we believe there’s more upside left in this bull run (even though some people of Crypto Twitter are calling for the end). We’re also going to show you why the current price, despite being near ATH, still is still attractive based on a very promising on-chain metric. Lastly, we’re going to show you a very important intermarket + macro chart that we have kept internal for quite a while, but are now going to share it with our Paid Members.
However, that’s only for Part 1 of this article. In the follow-up Part 2 (for Paid Members only), we’ll be taking a look at the altcoin market. Our members will have a first-hand idea of what on-chain data shows for altcoins, how far away is an altseason and a couple of attractive altcoin setups.


