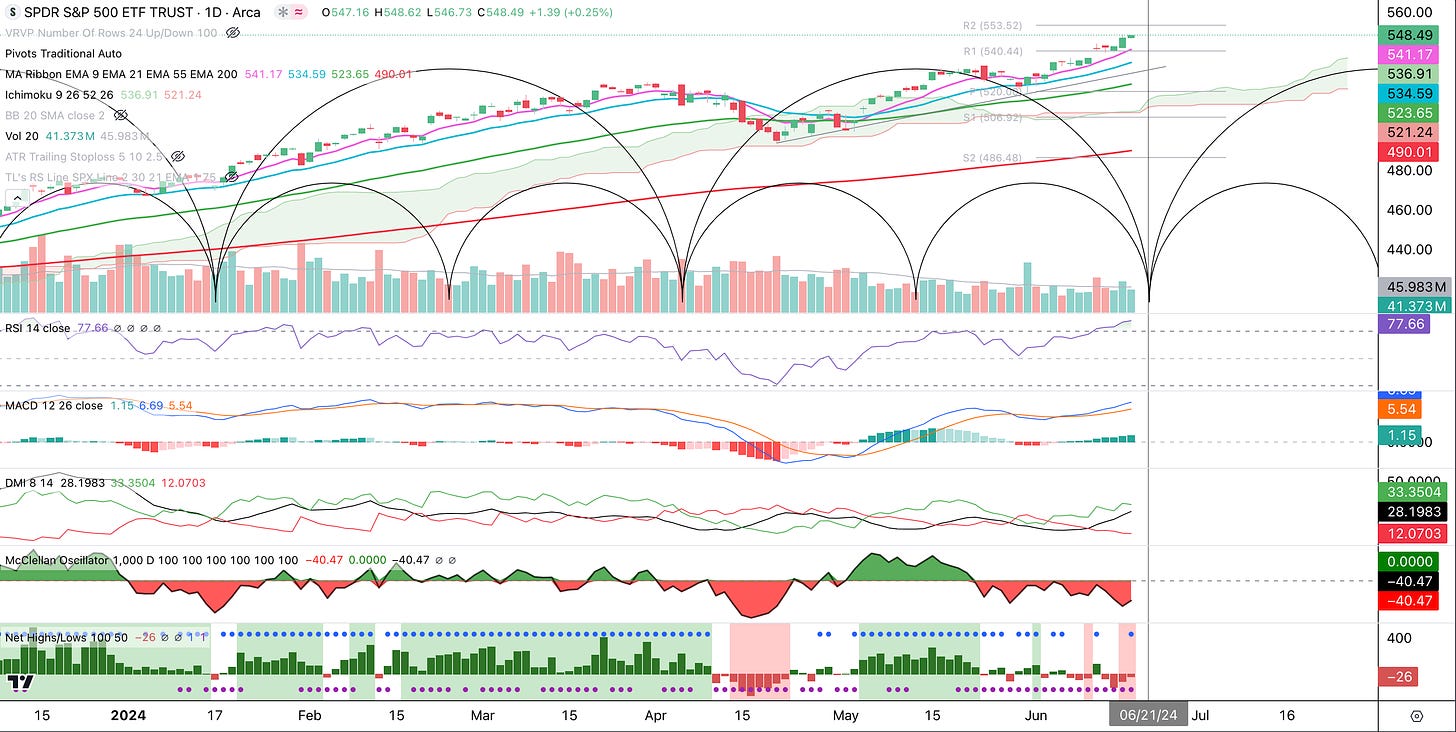
The S&P 500 (SPY) continues higher above the 9 & 21 EMAs and may be reaching for the R2 Pivot Point at $553.52, which is less than 1% away. This ascent is occurring on weak breadth as the McClellan Breadth Oscillator is still negative and there are now Net New Lows. Friday is Options Expiration day, which may bring some volatility. A bit of selling is definitely possible as RSI is in overbought territory. The cycle bracket renews on 6/21, which may bring a change in complexion. The combination of weak breadth and overbought conditions does not add up to a good risk/reward at the moment.
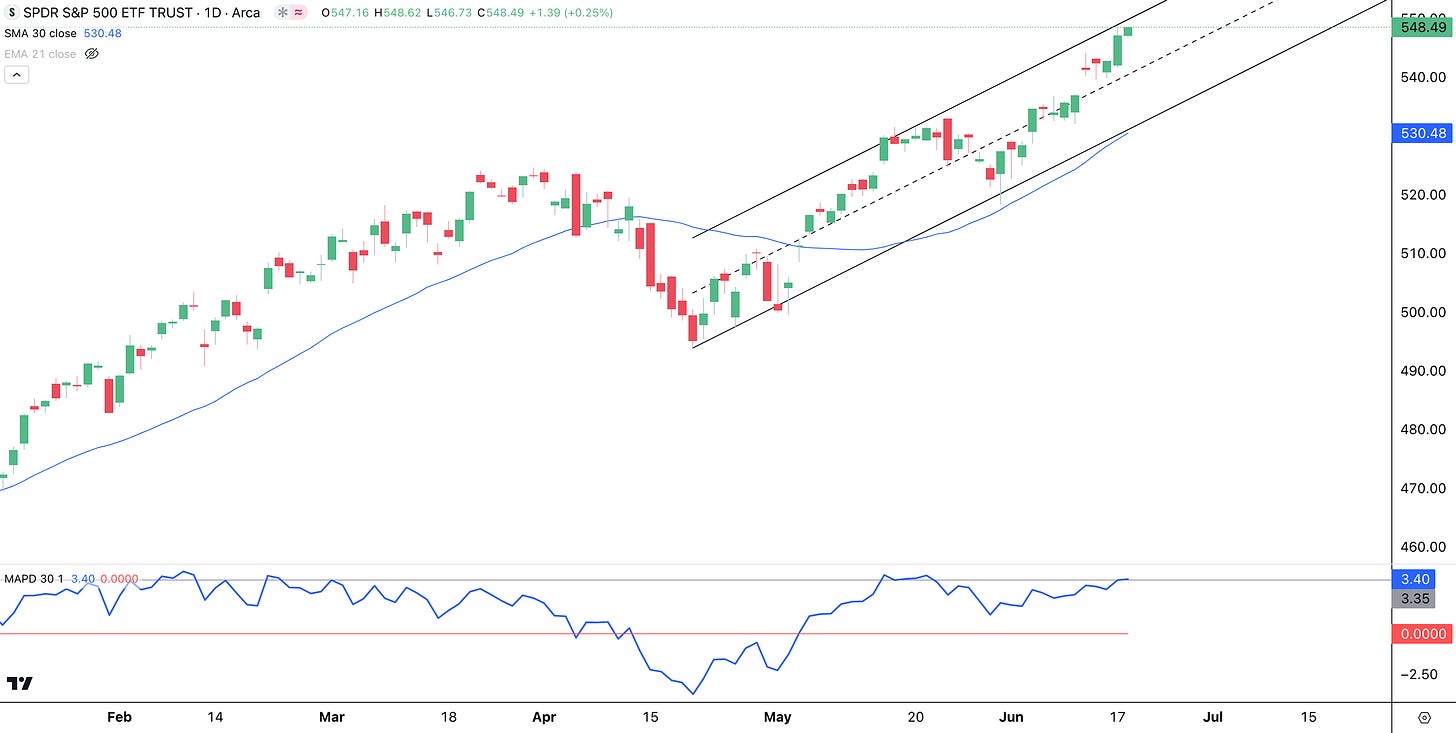
The chart below is a more simple chart of the SPY. We can see that it is at the top of the channel as it is stretched from the 30 SMA, which also coincides with the lower channel line. A pullback to the 30 SMA at $530.48, which is a 3.28% pullback, would reset overbought conditions in the RSI and would be a good entry point before the Independence Day rally.
Q32024 Cycle Forecasts
Our Q3 2024 Cycle Forecasts will be available on Wednesday 6/26 at cyclesedge.com. We will be covering Indexes, Sectors, Commodities, Cryptos and Leading Stocks. Founding Members will be emailed the Complete Set this weekend, before they are available to everyone else, so consider upgrading to the Founding Membership level. Here are a few examples:
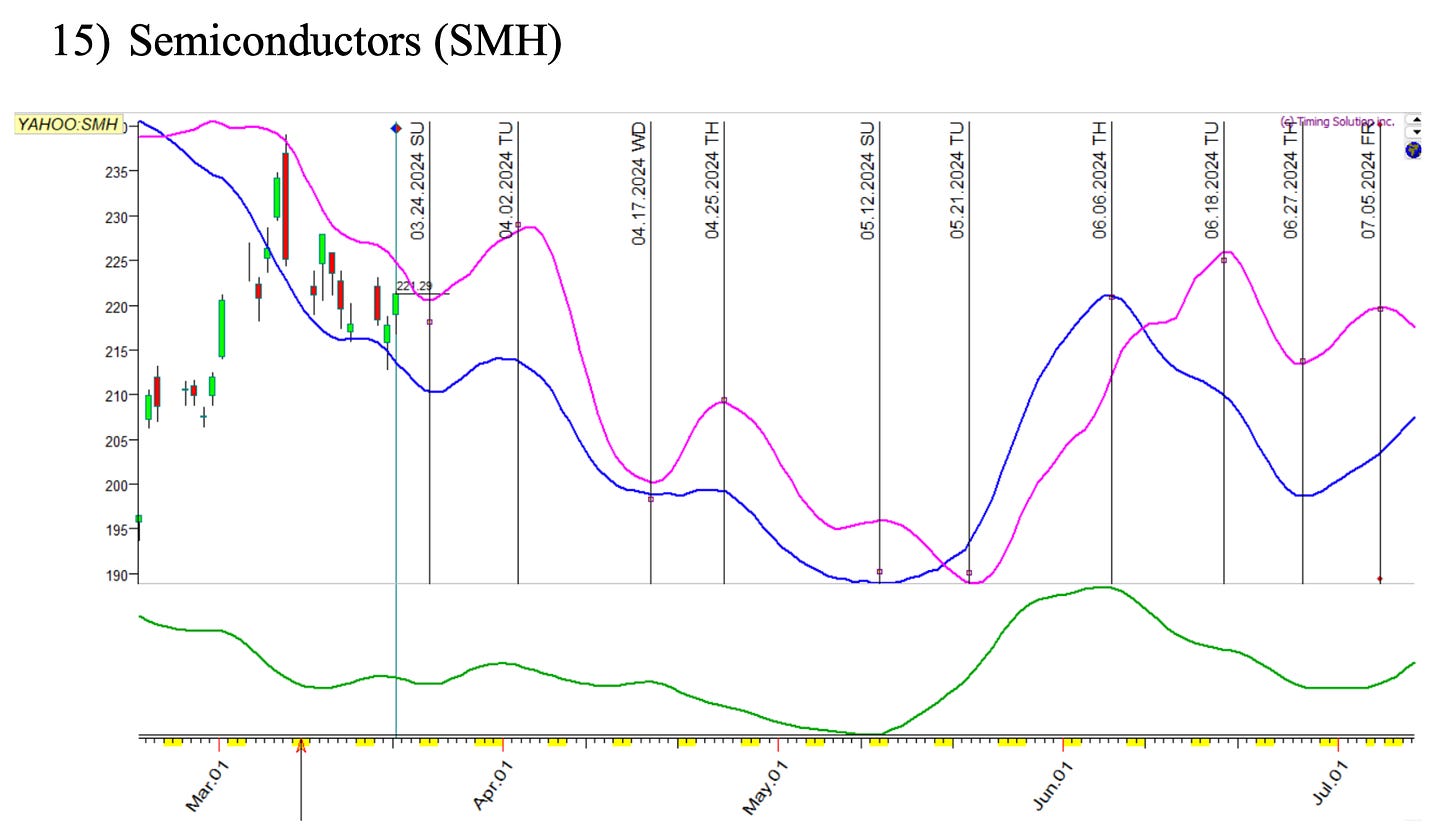
Semiconductors (SMH) Example: Our cycle forecast for the Semiconductors ETF (SMH) did a good job of catching the change in complexion around 5/12. Notice how our Cycles Composite (blue) and Energy Cycle (pink) were pointing down before 5/12, but reversed higher between 5/12 and 5/21.
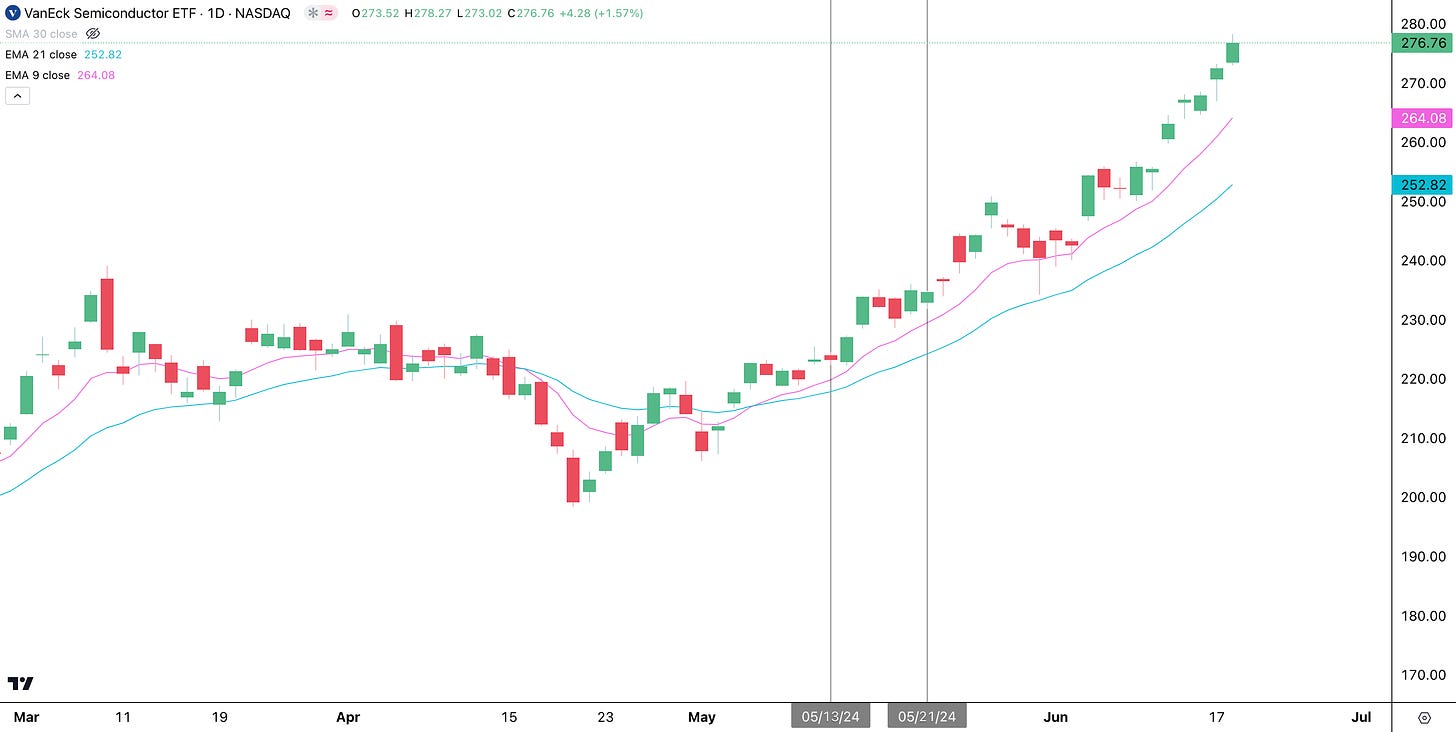
SMH had a sideways to downward trend in March and April. However as our cycles began to point up between 5/12 and 5/21 the price of SMH made its way above the 9 and 21 EMAs, leading to a strong uptrend. Those who had this cycle chart for SMH could have profited nicely.
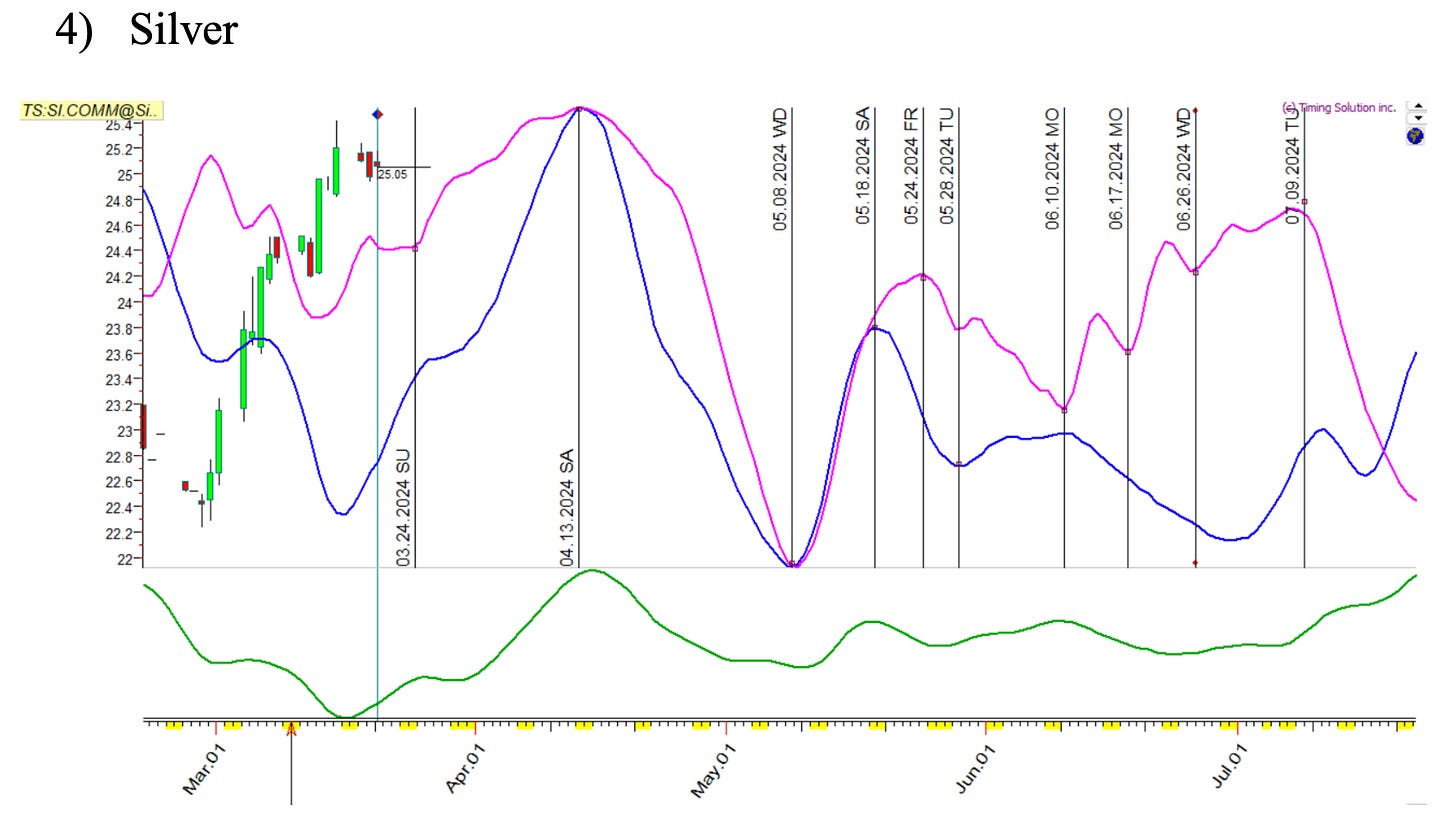
Silver (SI) Example: Our cycle forecast did a good job of forecasting Silver as well.
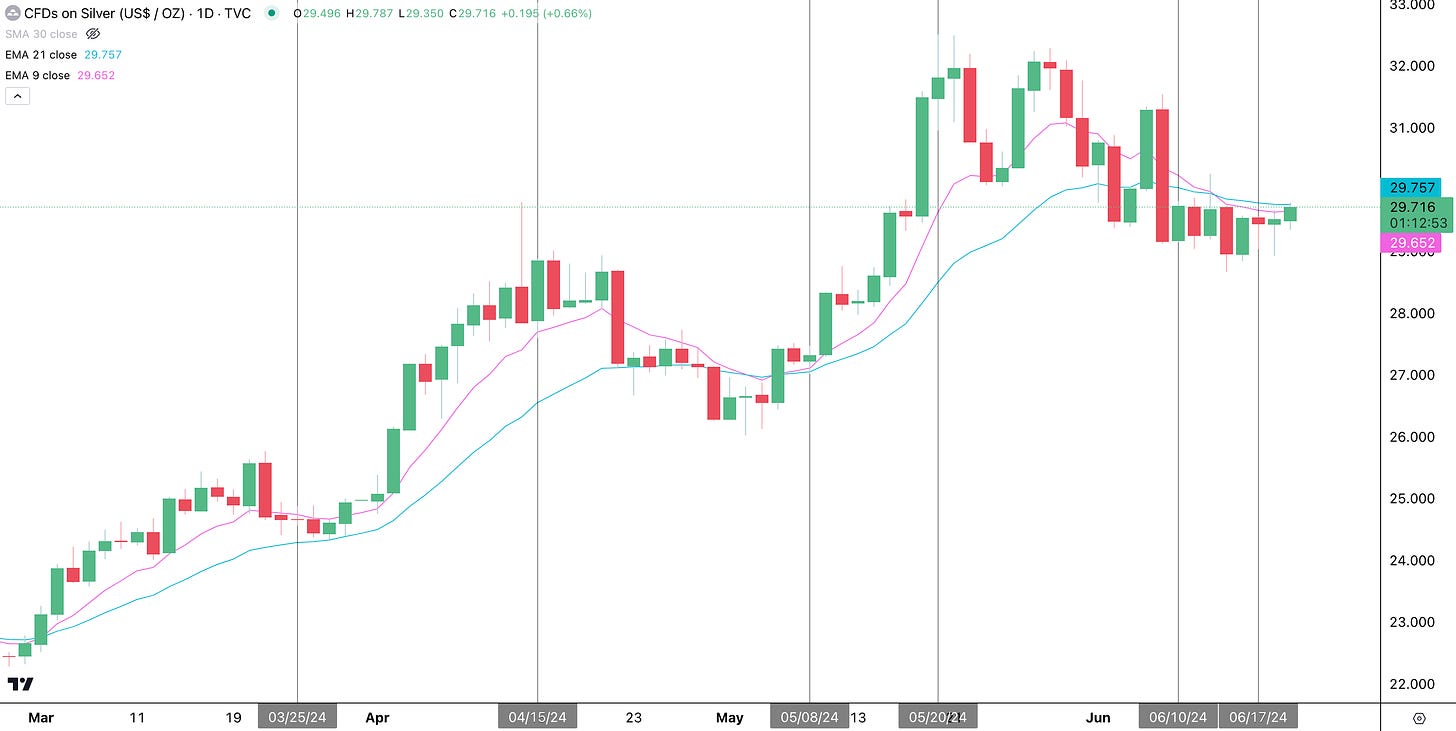
The Energy Cycle forecasted an upwards acceleration on 3/24 and although it was a bit early, Silver ended up making another leg higher. The Cycles Composite and Energy Cycle topped on 4/13 (weekend) and Silver topped on 4/15. Our cycles then bottomed on 5/8 and Silver bottomed a few days before. This led to another leg up. Now this is key…on 5/18 the Cycles Composite and Energy Cycle began moving in different directions, and price action became choppy. When the cycles point in different directions, this is often a warning that price action could get choppy. This is another way that cycle charts can be used well.
We hope that our Q3 2024 help you in your investing and trading journey. Again, they will be available for sale next Wednesday at https://cyclesedge.com/
Disclaimer - All materials, information, and ideas from Cycles Edge are for educational purposes only and should not be considered Financial Advice. This blog may document actions done by the owners/writers of this blog, thus it should be assumed that positions are likely taken. If this is an issue, please discontinue reading. Cycles Edge takes no responsibility for possible losses, as markets can be volatile and unpredictable, leading to constantly changing opinions or forecasts.


