Bitcoin
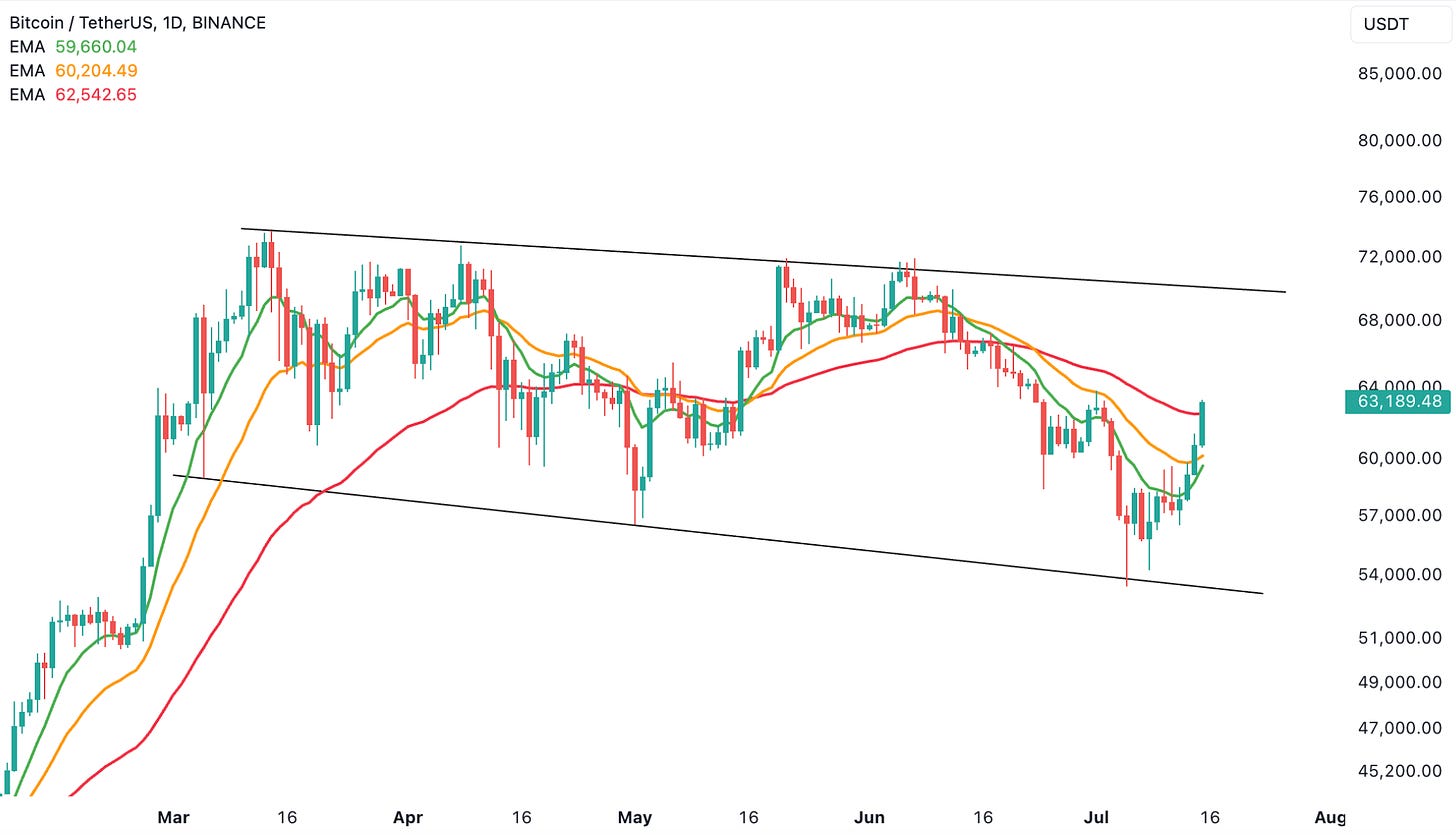
The first half of July has been a roller coaster ride for the Crypto market. Bitcoin had a weekly close below the critical $59.7k level, but reclaimed this level the very next week. Thus, there was no confirmation candle on the weekly timeframe (initial candle + at least 1 more candle in that same timeframe), which is very important when looking at major levels. During the pullback, Bitcoin reached as low as $53.5k, which coincided with the support line from the last 2 big downside wicks (as shown in the image below).
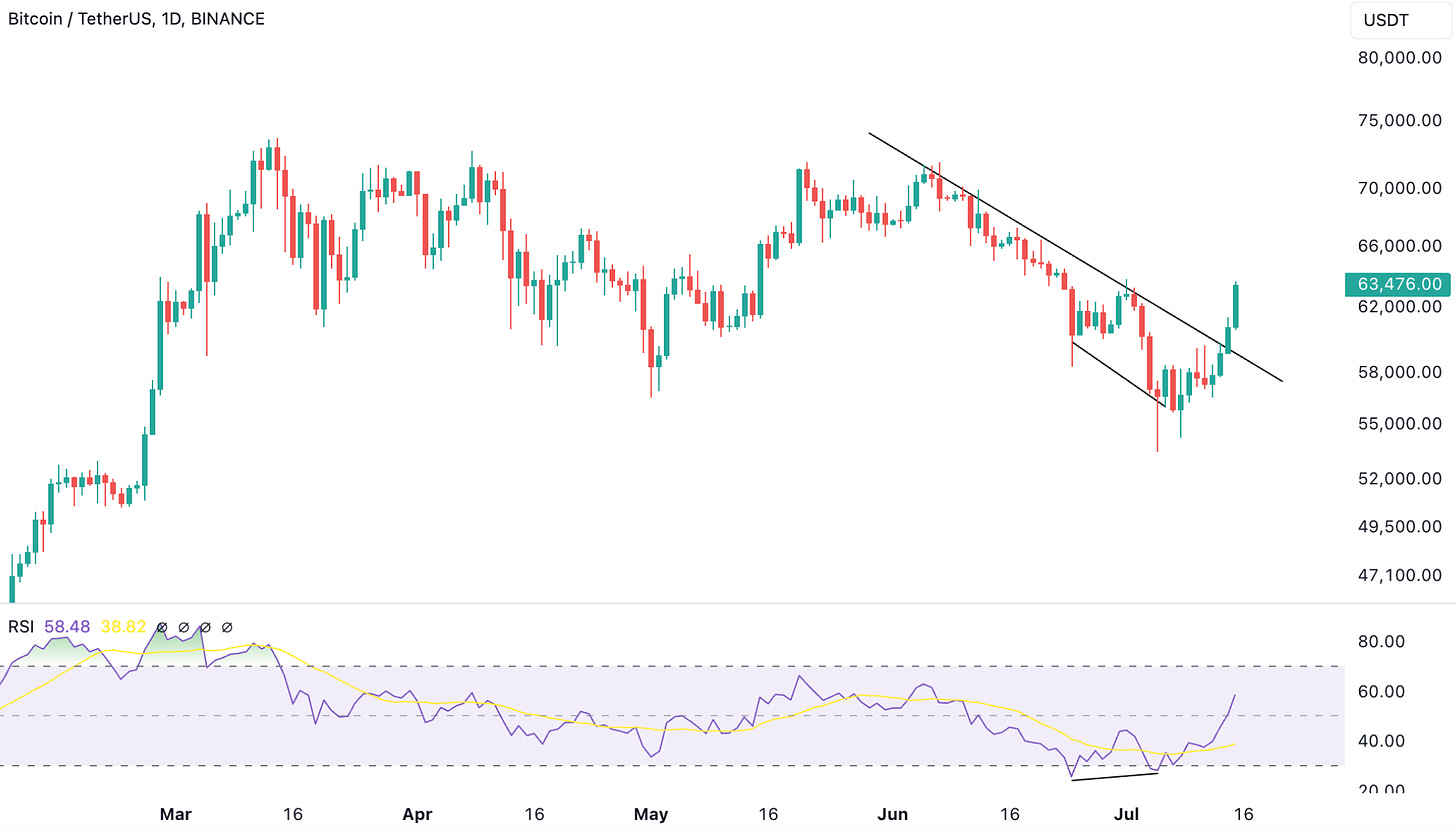
Now price has broken above the downtrend line following a daily bullish RSI divergence, which is a typical trend reversal signal.
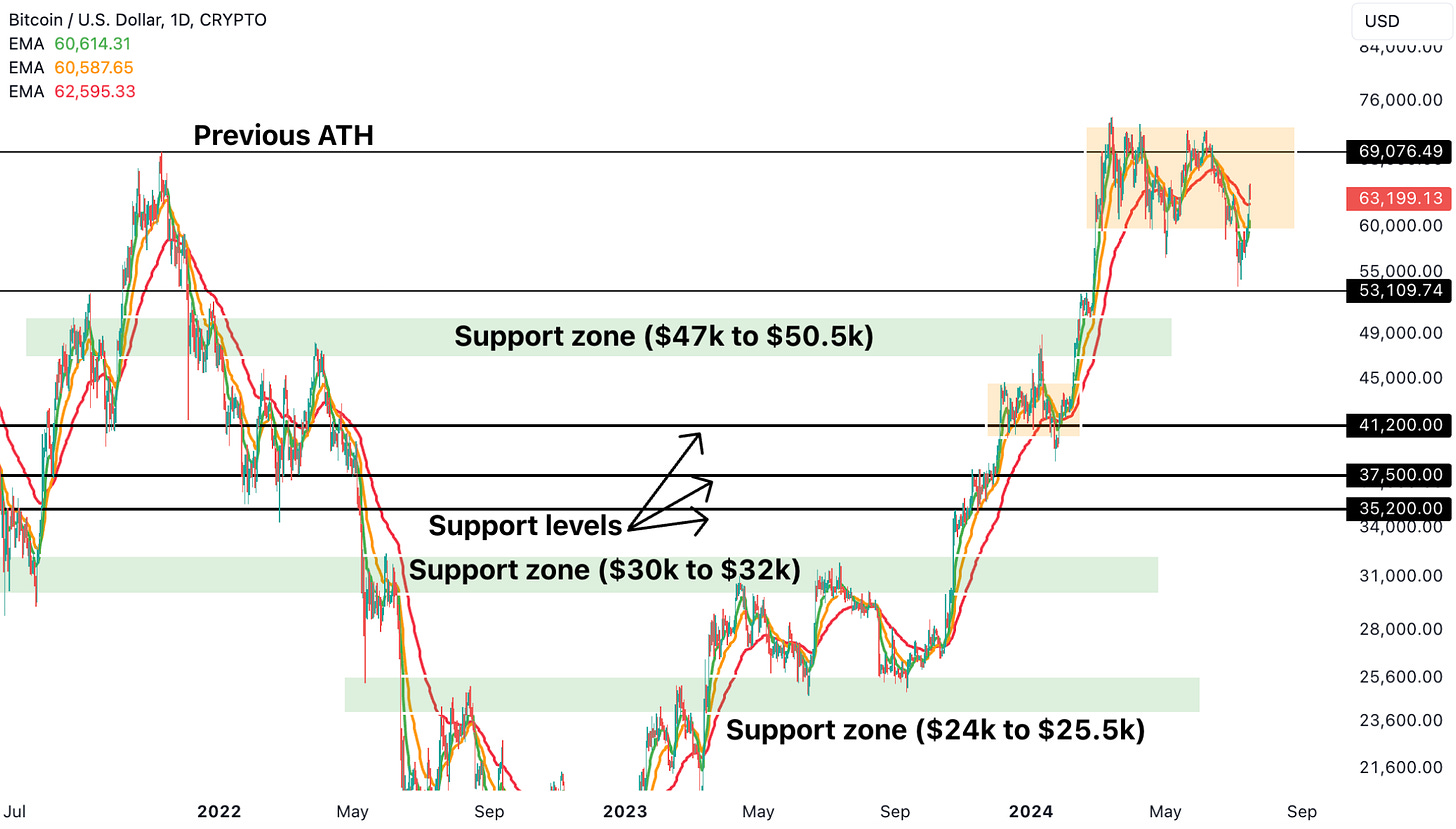
Price has also now reclaimed the 9, 21 and 55-daily EMA and has also moved back within the range highlighted in orange in the chart below. This deviation shook out the weak hands and has also trapped a lot of shorts. Following some consolidation in the range, we expect Bitcoin to attempt to break the $69k resistance once again. Now the fun begins for the Bulls!
Ethereum
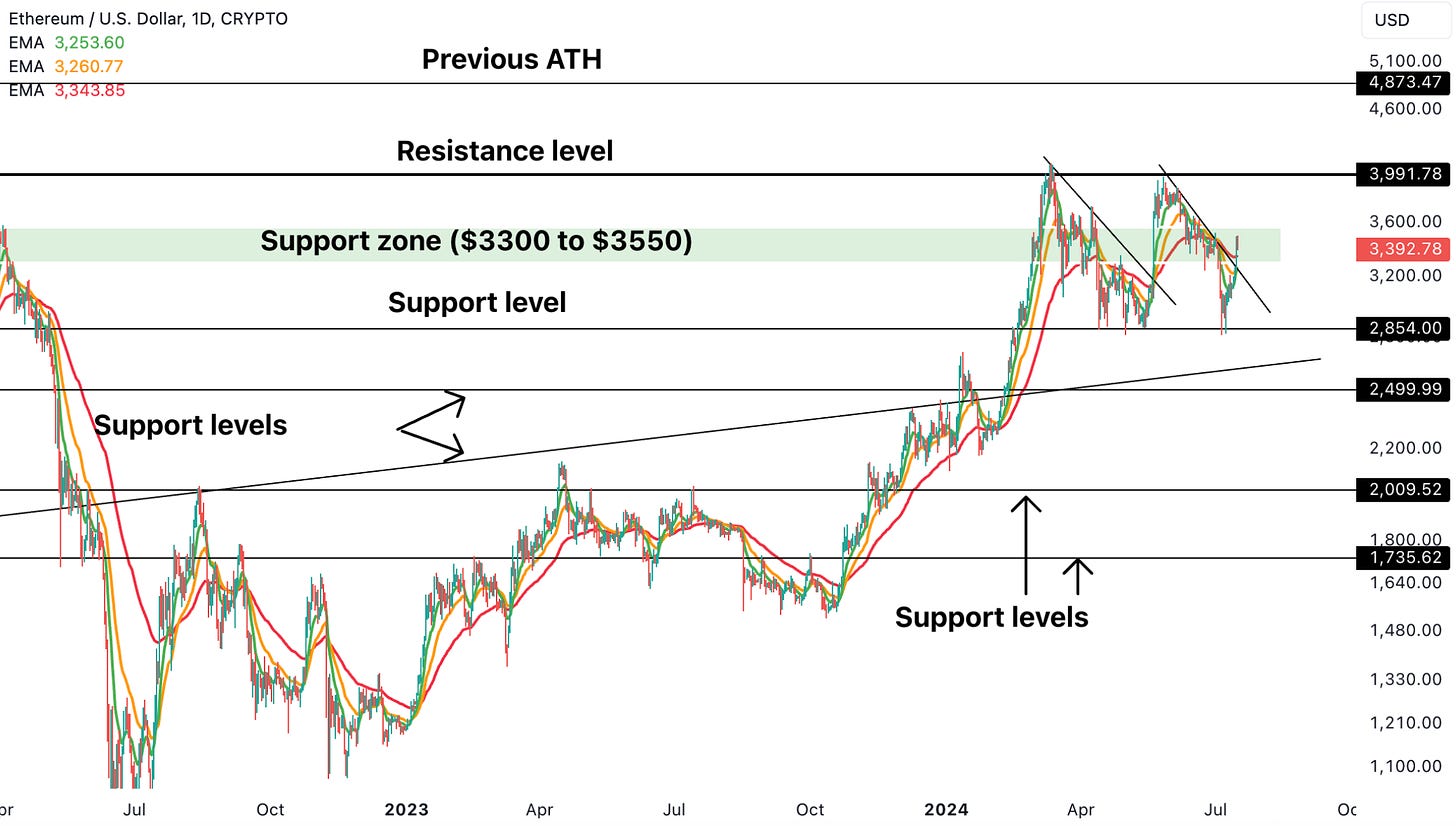
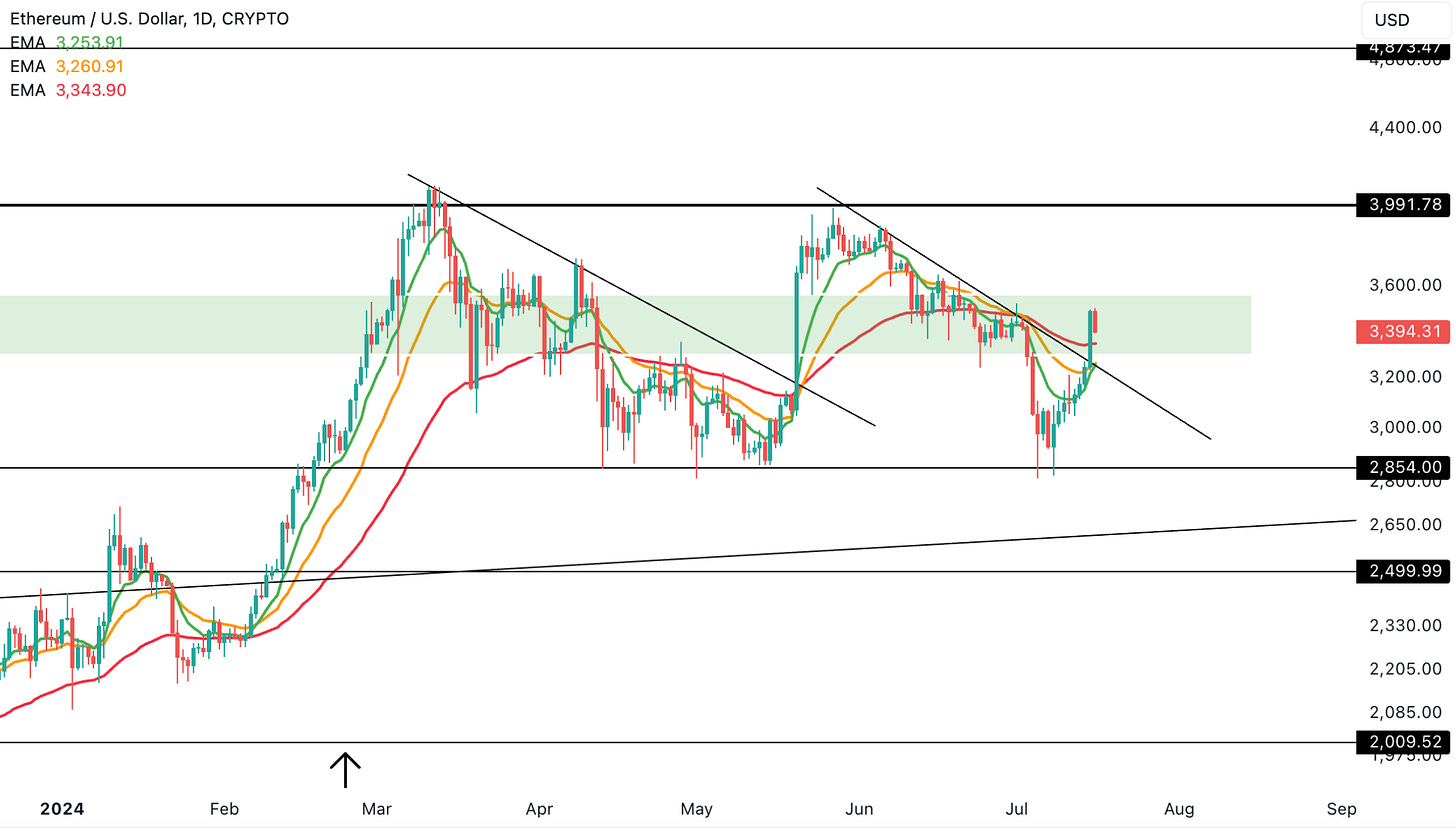
While Bitcoin’s pullback ended up with a lower price than the previous local low, Ethereum held up rather well. ETH revisited the $2850 support level, similar to the last pullback, and has now broken above the downtrend line (similar to earlier this year).
Currently in the support zone between $3300 to $3550, it is important to reclaim this zone to avoid making it into a resistance zone. However, with Ethereum ETF around the corner, we are confident that following some more consolidation, ETH is setting up an attempt to break the $4000 resistance level.
Moreover, if/when ETH breaks above the $4000 resistance level, the last 2 local lows at $2850 will confirm as a double bottom. This price pattern would have target of $5150, which would be a new ATH for Ethereum.
Similar to Bitcoin, Ethereum has also reclaimed its 9, 21 and 55-daily EMAs. All 3 of these moving averages are also beginning to curl up, which is another positive development for the bulls.
In the next section (for Paid Members), we’re going to take a look at some very important aspects:
ETH/BTC ratio
Dollar index – intermarket signal
How do we know that this move in Bitcoin is real? This proof is rather very convincing and something to continue monitoring for assessing risk-on environment
A Bitcoin fractal that you do not want to miss! Gold has already done this type of a structure in the past, so we can get an idea of what to expect
What is the next big upside level for Bitcoin?
NOTE: Our Q3 2024 Cycle Forecasts is now available for sale on cyclesedge.com. We are covering multiple different Indexes, Sectors, Commodities, Cryptos and Leading Stocks using our proprietary Cycles Forecast. Founding Members have already been emailed ALL the Q3 2024 Cycles Forecast. This is one of the many benefits of being a Founding Member, so consider upgrading your membership. In case any of our Founding Members have not received the full Q3 2024 Cycles Forecast set, please reach out to us via email or Substack message. We also have another surprise in the works for our Founding Members, which will be released later in July.


