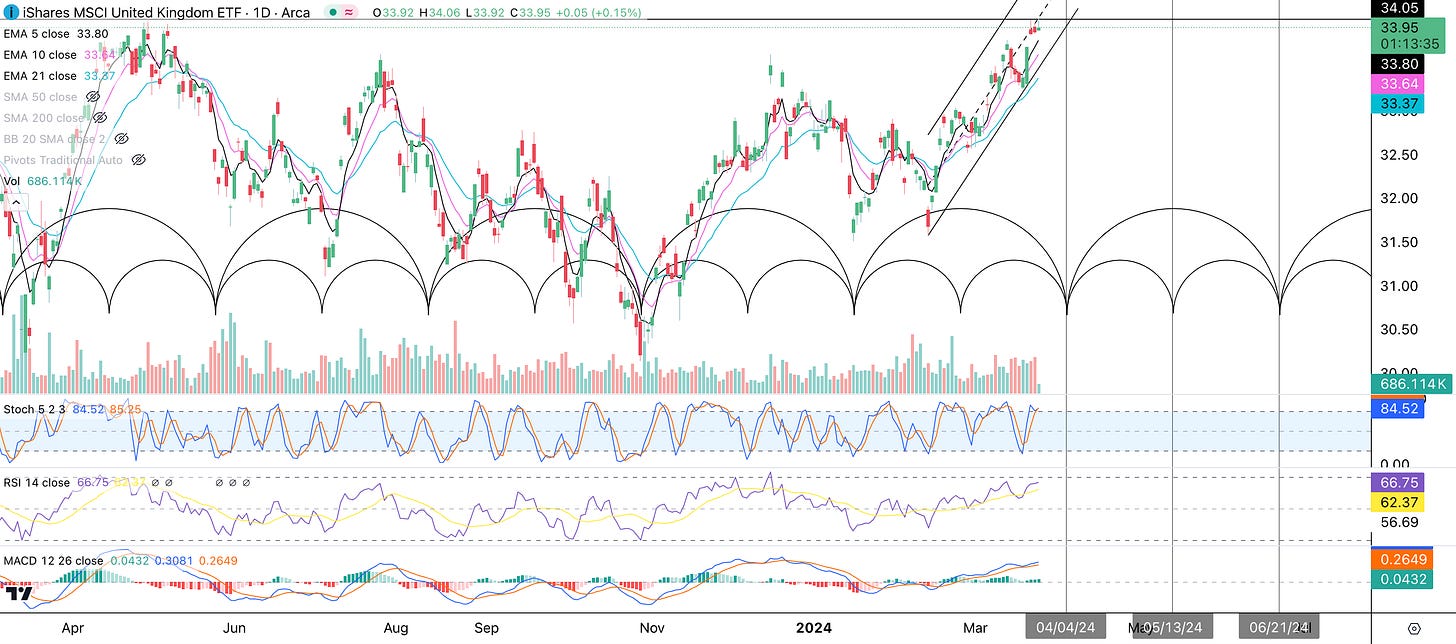
The United Kingdom’s main stock index the FTSE 100 (we will use the ETF “EWU” as a proxy) has been in a range for over a year and is now poised for a breakout. Moreover, our cycles are picking up a buy point coming up soon.
Looking at the weekly chart you can see that EWU has been in a range since mid-March 2023 and formed a reverse head & shoulders pattern. The upside target of the pattern is $37.75, roughly an 11% gain.
However, what makes the upside potential even greater is the fact that EWU has been in a larger reverse head & shoulders pattern since March of 2022 (see the zoomed-out weekly chart below). If this pattern hits its price target of $42.40, it would provide roughly a 25% gain.
EWU appears to be following a 54 trading-day cycle bracket, which divides into 27 trading-day half-cycles. A new cycle is coming up around 4/4, so expect some weakness over the next few days, which will be a buying opportunity. For this trade to work, the lower channel line must hold and the price should not get below $33 or the 21 EMA. If this breaks out then there should be upward movement until early May when the half-cycle begins to trough. This could be a buying opportunity. The cycle ends around 6/21. A pullback to the 10 EMA would provide an excellent entry point.
For paid members, we’ll share our 2024 Cycle Forecast for the FTSE 100.
If you are interested in seeing our Q2 2024 Cycle Forecasts for Indexes, Sectors, Cryptocurrencies, Commodities, or the Magnificent 7 & Other Leader Stocks you can check them out here: https://cyclesedge.com/
Disclaimer - All materials, information, and ideas from Cycles Edge are for educational purposes only and should not be considered Financial Advice. This blog may document actions done by the owners/writers of this blog, thus it should be assumed that positions are likely taken. If this is an issue, please discontinue reading. Cycles Edge takes no responsibility for possible losses, as markets can be volatile and unpredictable, leading to constantly changing opinions or forecasts.


