In our last Uranium article (found here), we wrote about Uranium’s supply squeeze and the Money Making opportunities present in this asset class. That’s been playing out extremely well for our subscribers who executed on our Uranium suggestions.
But is it too late now? If not, then where are the Uranium focused opportunities? That’s exactly what we’ll cover in this article.
Spot Uranium Technicals
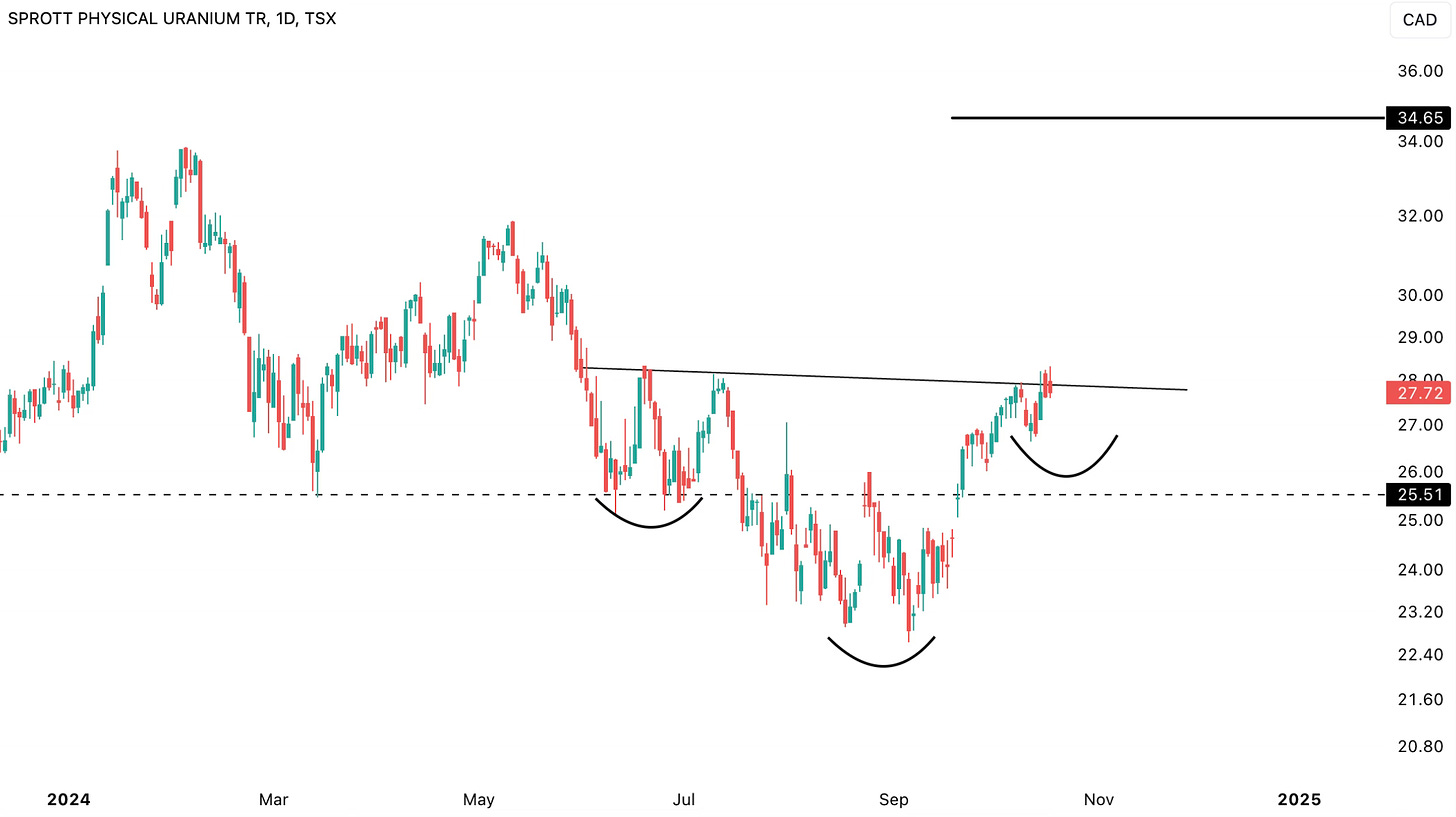
Uranium has been putting in an inverse head and shoulders basing pattern. The neckline that’s to be broken above currently stands around $28.23.
However, the right shoulder could take some additional time to form. As far as price is above $25.51, the inverse head and shoulders pattern is still intact.
Once the inverse head and shoulders gets confirmed, then the pattern target of $34.65 would be at play.
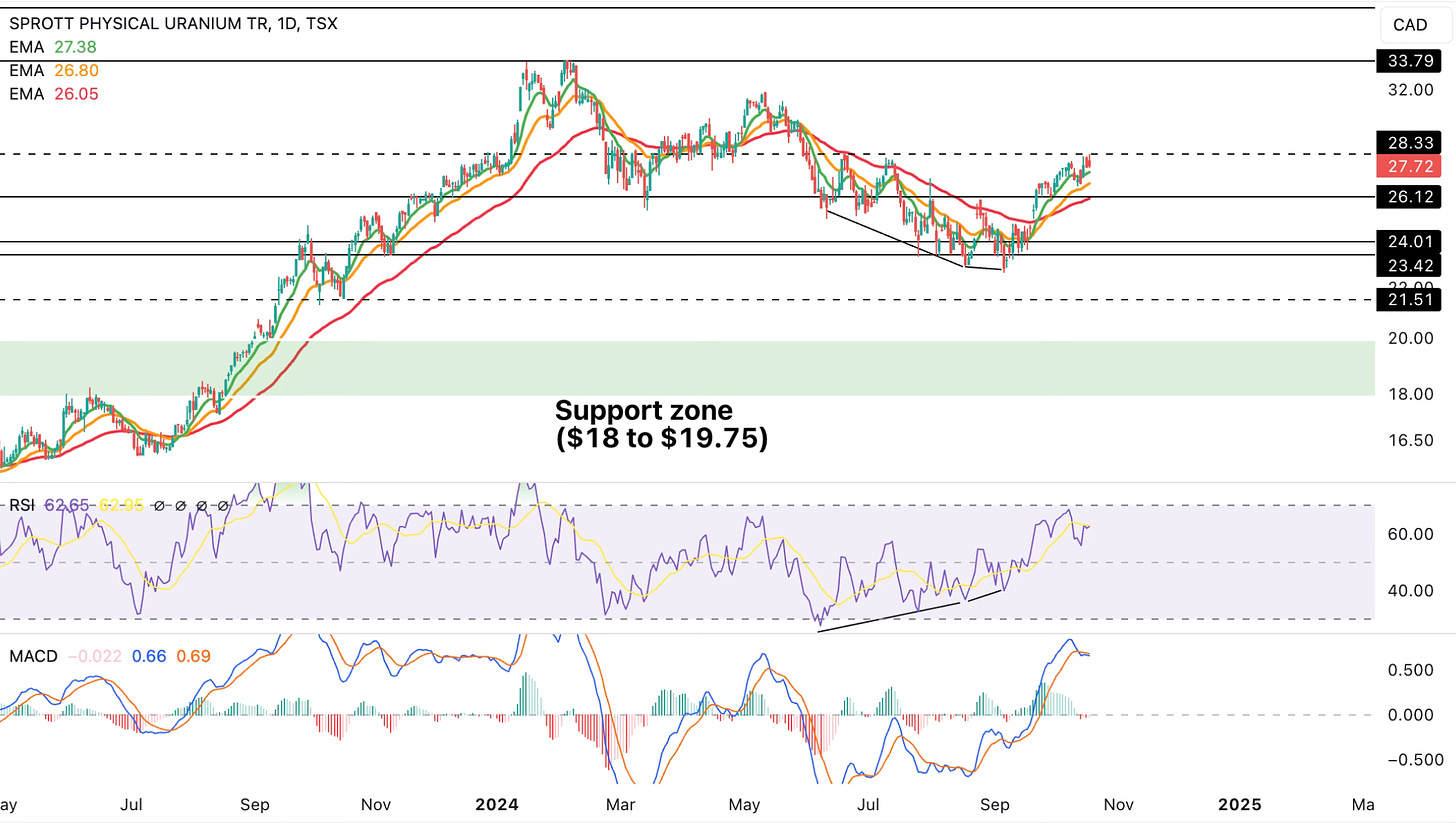
The reason we say that the right shoulder of the inverse head and shoulders pattern could take some additional time is because the daily MACD just flipped bearish, indicating a loss of momentum in the near-term.
Areas of interest for a potential pullback are the daily 21-EMA (orange line) and daily 55-EMA (red line), which are currently at $26.80 and $26.05 respectively.
Spot Uranium Supply Squeeze
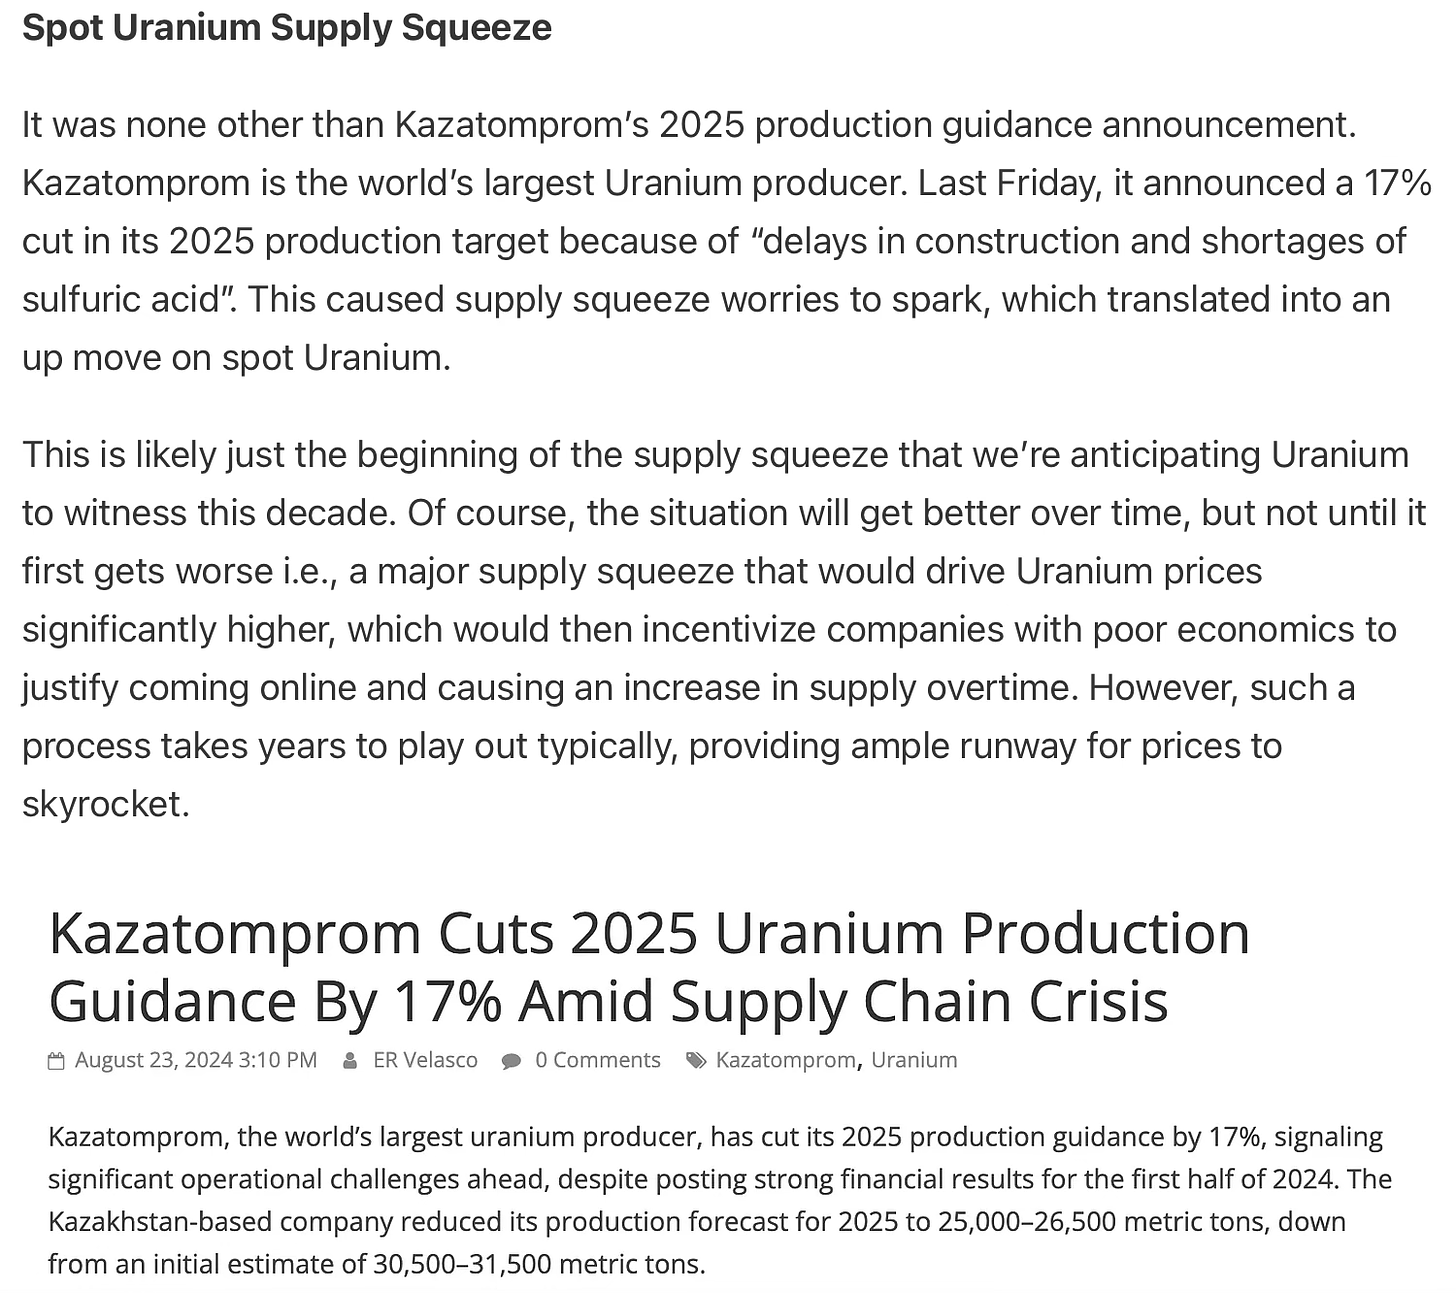
One of the primary reasons we’re extremely bullish on Uranium for the next few years is because of the supply shortage that’s been building up.
Here is a section that we wrote in the last Uranium article highlighting the supply squeeze that’s building:
Uranium Seasonality
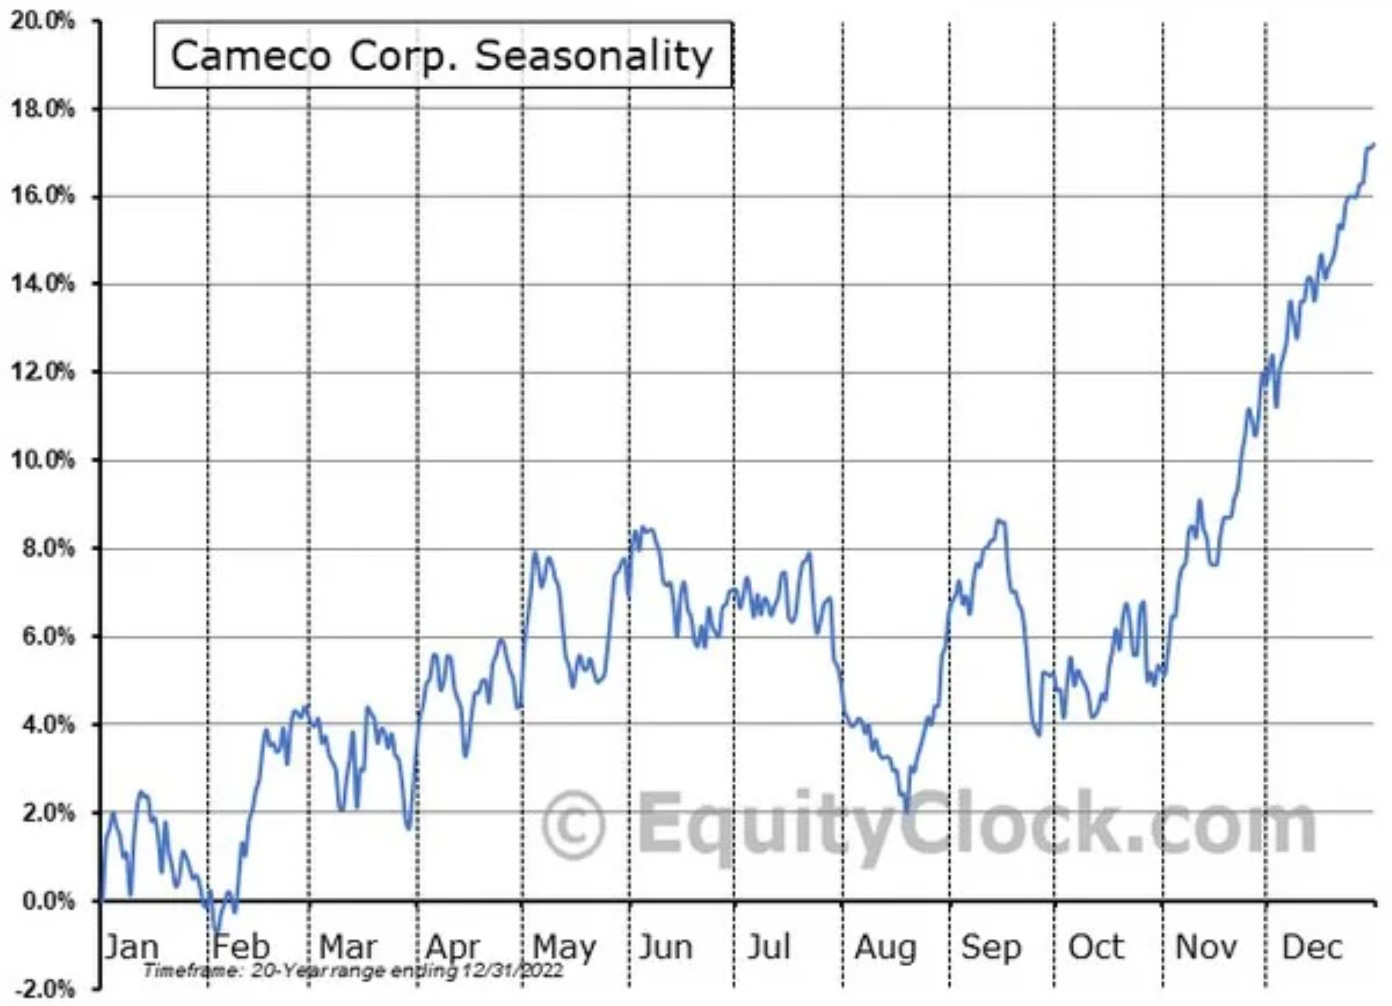
Cameco is one of the largest Uranium producers. Since we don’t have Uranium’s Seasonality, we’ll look at Cameco’s Seasonality instead to get at least some insight from a Seasonal trend perspective.
November and December specifically tend to be quite bullish months for Cameco, indicating that this can also be expected for spot Uranium generally speaking.
Uranium Miners ETF ($URNM)
In our previous Uranium article (found here), we were telling our members to buy $URNM at $43.32, which ended up being quite a profitable entry for those who executed.
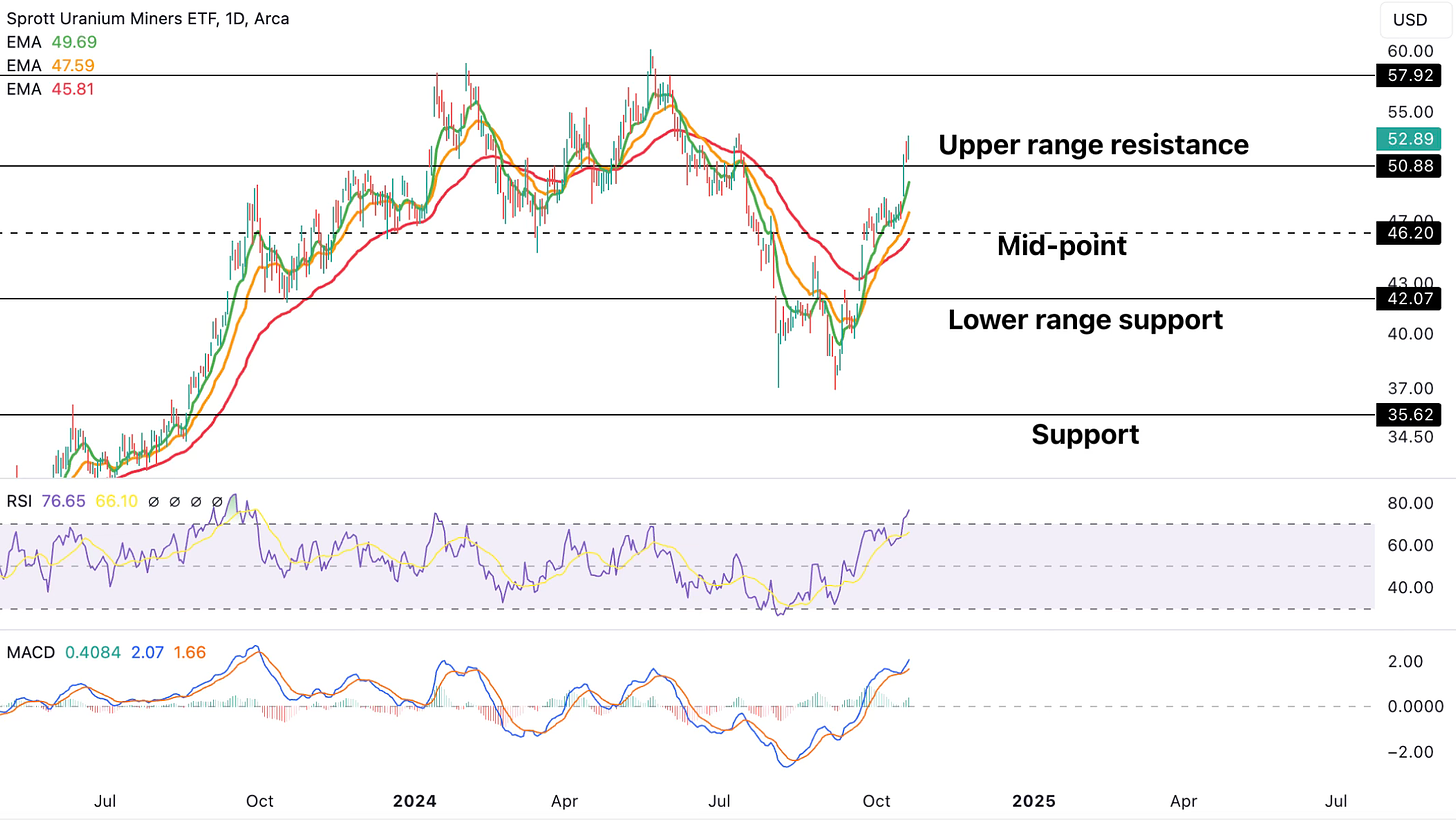
Now, $URNM has reclaimed the upper range resistance level at $50.88, but the technicals have gotten quite over-extended in the process.
Some cool off here would make sense. In the event of a pullback, we’re interested in the $50.88 level and if that is lost then the $46.20 level.
The next upside level of interest is $57.92 and then $URNM is off to new ATHs!
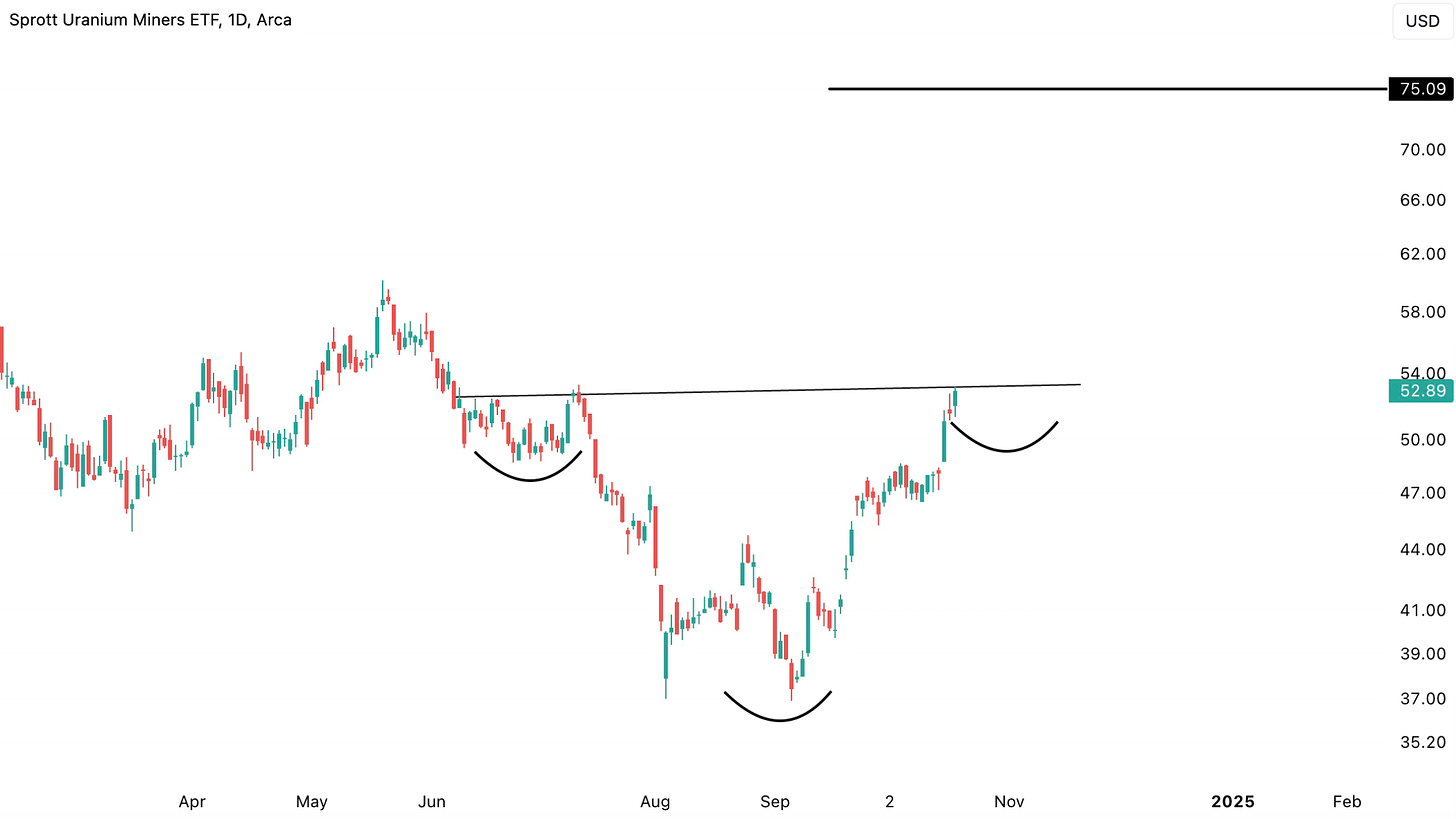
Another scenario that we’d like to highlight is the potential for an inverse head and shoulders pattern to form.
The right shoulder is still a question mark right now, but if that forms and price breaks above $53.15, then the pattern target would imply a move to $75.09.
Junior Uranium Miners ETF ($URNJ)
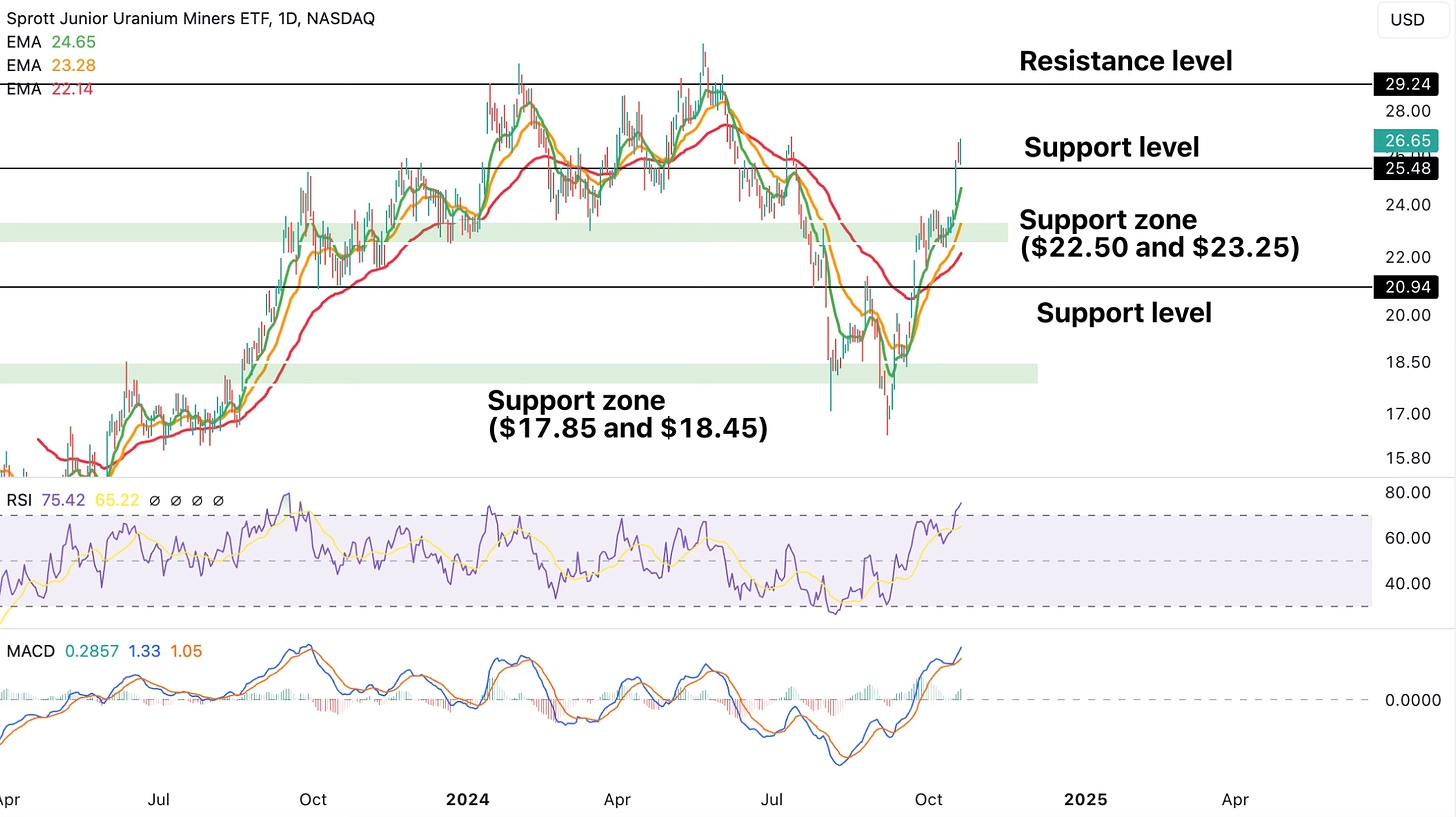
Even $URNJ has shown quite a lot of strength. We were telling our members to buy at $20.61 (here) and now price has reclaimed the $25.48 support level in the recent run-up.
During the rise, technicals have gotten quite over-extended, so a pullback to $25.48 or even the support zone between $22.50 to $23.25 is possible. Both would be good buying opportunities for those who missed out on the earlier buy.
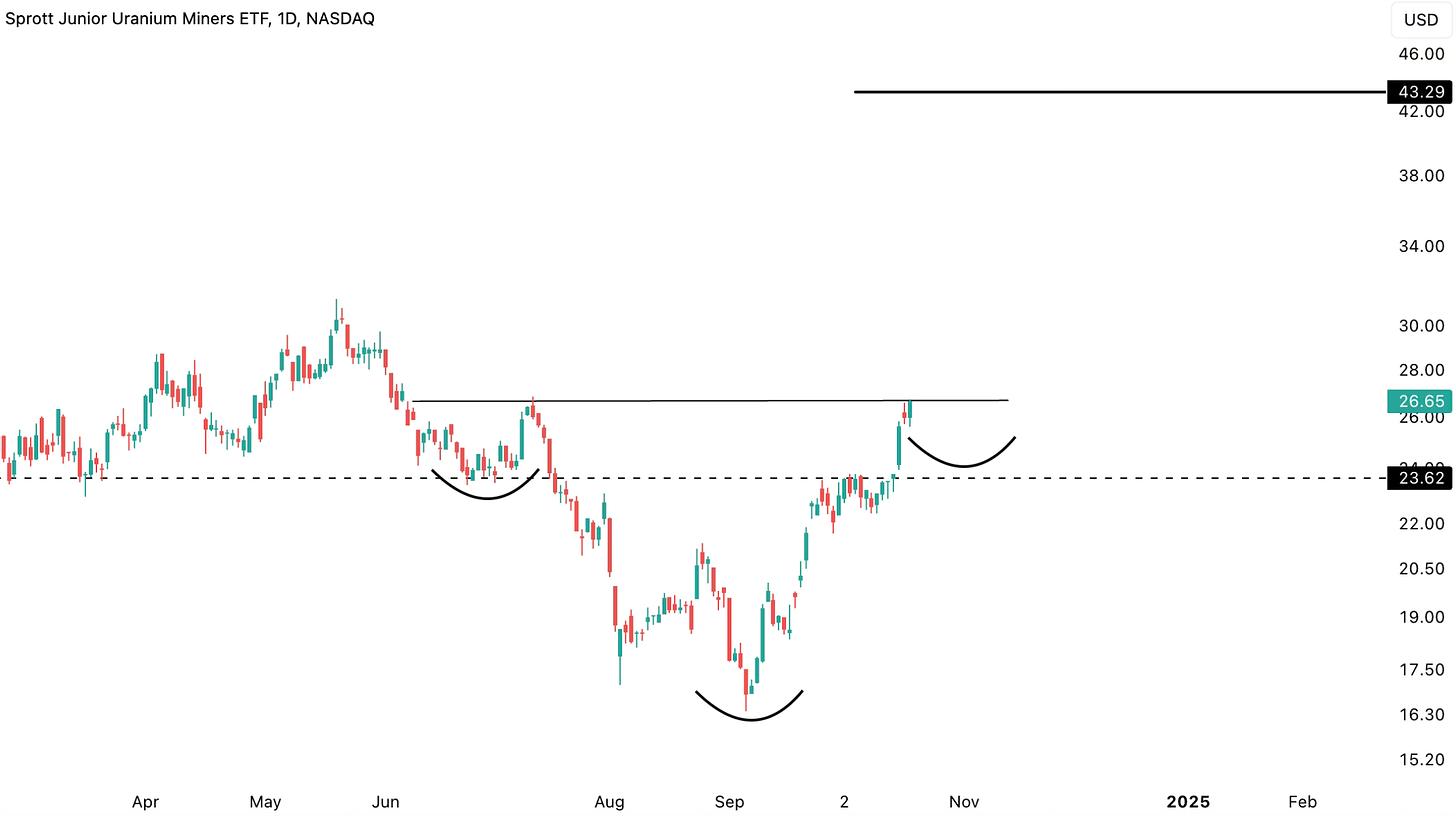
Similar to $URNM, even $URNJ has the potential for an inverse head and shoulders to form. If the right shoulder does form and price breaks above the $26.86 neckline, then the pattern target would imply a move to $43.29.
Next up, we’ll cover our proprietary Cycle Forecasts for Uranium to get a timing Edge. Then, we’ll dive into 5 individual Uranium stock setups to maximize profits from Uranium’s run-up. Individual Uranium stocks provide the highest potential for Making Money.
Find our membership cost/benefits below. If you’re serious about Making Money (our primary goal at Cycles Edge), then the Premium Sections are key for you!
Uranium Cycle Forecasts


