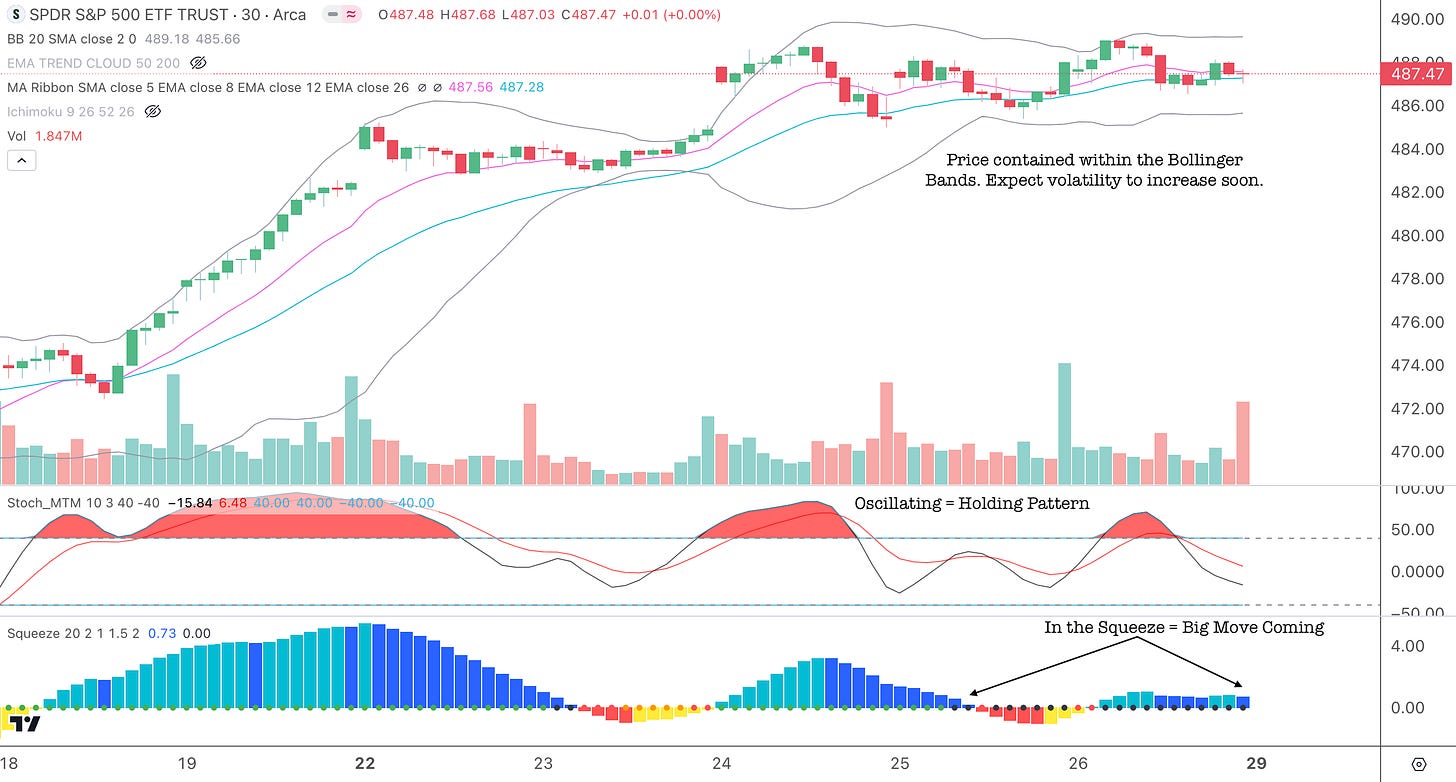
The market turned choppy in the short term, although it remains in an uptrend on a longer timeframe. Looking at the S&P 500 (SPY) on a 30-minute chart you’ll notice that price action went into “The Squeeze” last week, where it oscillated between the upper and lower Bollinger Bands (grey lines) as the Bollinger Bands contracted. The Squeeze is confirmed by the TTM Squeeze indicator and means that price is in a contraction phase, but waiting for a catalyst to break out of the contraction phase and start a new expansion phase.
Catalysts appear to be lined up to trigger a new expansion move next week, whether it be up or down. There is an FOMC meeting and rate decision on January 31st. Furthermore, all eyes will be on Mega-Cap earnings as AMD, GOOGL, MSFT, MA, AAPL, AMZN, and META report 4th quarter earnings next week. Wall Street will be reviewing these earnings reports carefully to get a gauge of the business environment.
The Market’s Health: In a Holding Pattern
The market is still in an uptrend above all moving averages, despite slowing down and becoming choppy on a short-term timeframe.
Breadth - Overall breadth as measured by the McClellan Oscillator is weak, but on the bright side, there are still Net New Highs. The Percent of Stocks Above the 20 SMA is recovering. Breadth is not great at the moment, but not weak enough to drop the market.
Volatility - The VIX is at 13.25, which is still quite a low level. This is supportive of higher prices.
Sentiment - Smart Money and Dumb Money both bought the dip last week. If the buying continues, higher prices are possible…
…especially as Greed makes its way back into the market.
Intermarket Analysis - The Intermarket picture is a bit worrisome. The 10-year Treasury Rate (TNX) and US Dollar (DXY) may both be in an early uptrends and this does not help the stock market rally. Moreover, oil appears to be back in an uptrend, and this could support renewed inflation.
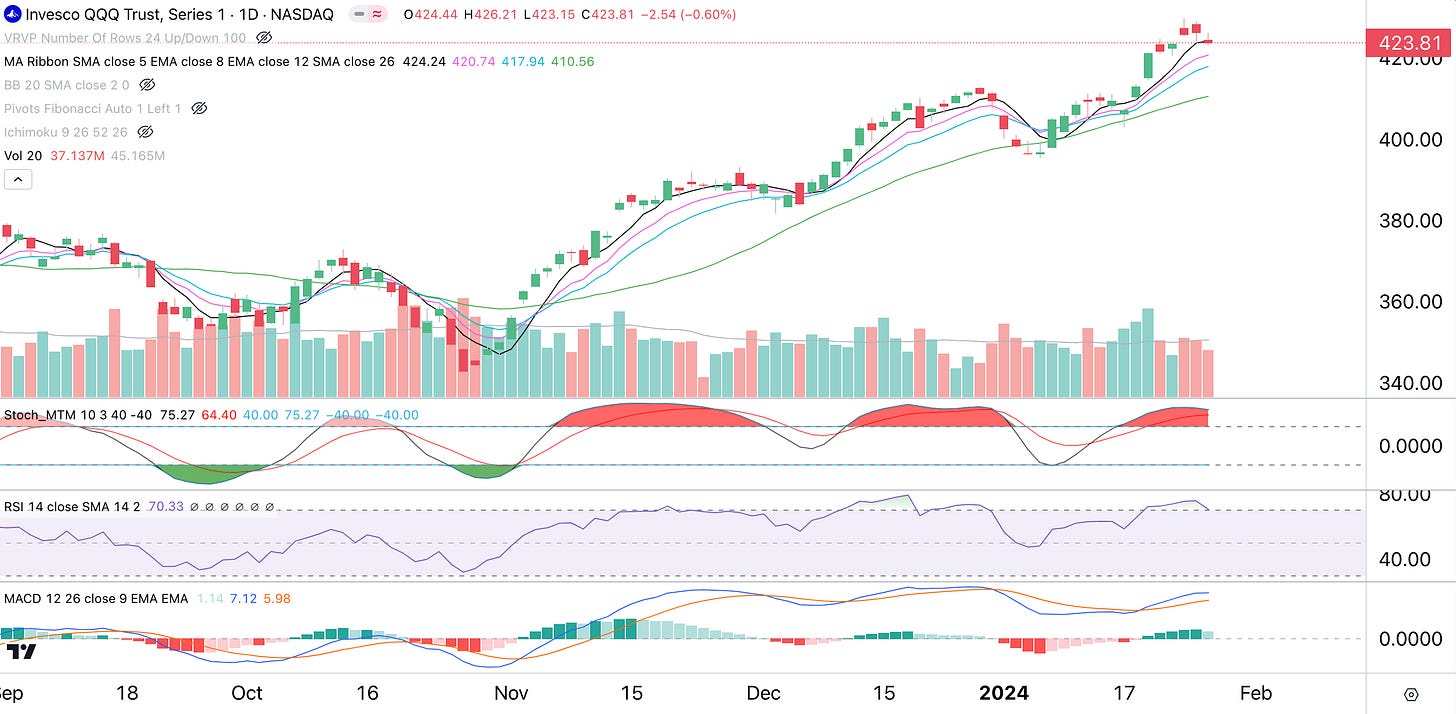
Nasdaq 100 - Profit-taking is hitting the Nasdaq 100 (QQQ) as this index has noticeable relative weakness to the SPY. The price of QQQ closed below the 5 SMA, which is the first sign of weakness. The Stochastic Momentum and RSI indicators are also overbought and look ready to head lower. Investors may be trimming exposure to Magnificent 7 stocks before earnings.
Cycles: Dynamic Cycles Provide A Different Approach
This week let’s look at Dynamic Cycles. We can do that by using Timing Solutions software to tell us which are the most active and influential short-term (days) and intermediate-term (weeks) cycles in play.
We found that the S&P 500 follows the 27-bar (trading day), 40-bar, 52-bar, 80-bar (16 weeks), and 110-bar (22 weeks) cycles. The composite of these cycles is represented by the aqua cycle forecast below. You can see that in 2023 the combination of these cycles was pretty good at finding turning points. You can also see that the cycle top on 11/19/23 ended up being an inversion, where the price action went in the opposite direction of the cycle forecast. Some cycle analysts use dynamic cycle turning points as an area of interest that could bring a change in the character regardless of direction. For example, the price action could accelerate or reverse or turn choppy. The 11/19/23 turning point brought an acceleration in the direction of the trend.
1/18 was a cycle bottom and the SPY followed the up-cycle to new highs. This up-cycle lasts until 2/7 when a small pullback is possible until 2/16. Another up-cycle is possible from 2/16 to 3/17. That could be followed by a pullback from 3/17 to 4/3.
By comparison, our static cycles are less bullish. The Cycles Composite (blue) Energy Cycle (pink) and Seasonal Cycle (green) forecasted a top around 1/17, however, this seems to be inverted. These cycles show possible turning points on 2/23, 3/3, and 3/29.
Be mindful that cycle inversions do occur, so always use a technical chart to confirm price action and always manage your own risk.
Seasonality: Biden vs. Trump Round 2
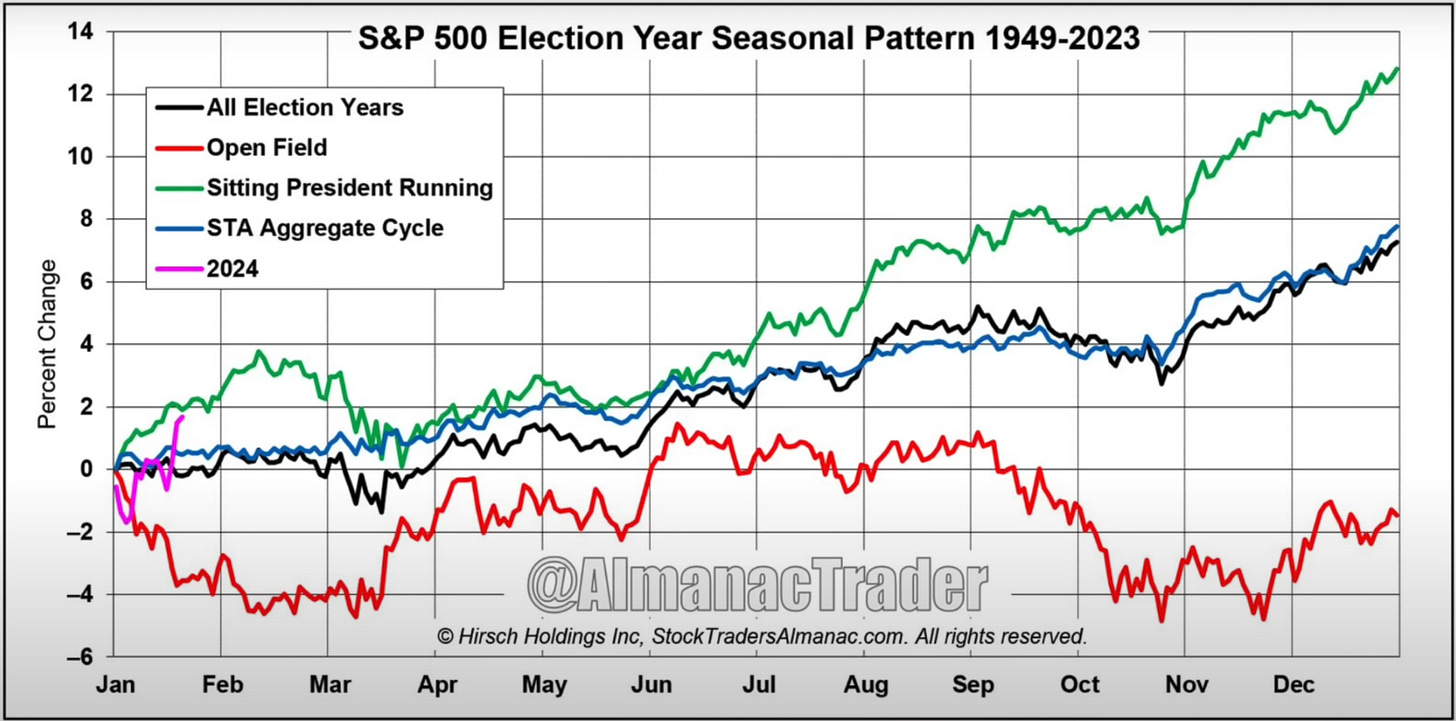
The 2024 Election is shaping up to be a Biden vs. Trump battle once again. In the Stock Traders’ Almanac seasonality chart below, this qualifies as a “Sitting President Running” situation, which is usually bullish until a possible pullback in mid-February, followed by another uptrend from mid-March until the end of April.
Conclusion:
Trend = Uptrend
Breadth = Weak
Volatility = Low
Sentiment = Bullish
Intermarket Dynamics = Unsupportive
Dynamic Cycle = Bullish
Static Cycles = Bearish
Seasonality = Bullish
Looking at the conditions we covered, there does not seem to be a consensus at the moment. The trend is up, so long trades will have the edge. Next week will bring huge catalysts and we’ll have to be vigilant to see if the market continues to climb a wall of worry or if the FOMC meeting or Mega-Cap earnings changes the complexion of the market. We’ll also have to see if the Nasdaq 100 continues its relative weakness compared to the S&P 500. Things are about to get a lot more volatile as expansive price action is expected to return next week.
For Paid Subscribers we’ll go over Dynamic Cycles for the Nasdaq 100, Russell 2000, and Dow Jones Industrial Average.
Disclaimer - All materials, information, and ideas from Cycles Edge are for educational purposes only and should not be considered Financial Advice. This blog may document actions done by the owners/writers of this blog, thus it should be assumed that positions are likely taken. If this is an issue, please discontinue reading. Cycles Edge takes no responsibility for possible losses, as markets can be volatile and unpredictable, leading to constantly changing opinions or forecasts.


