Warning Signs Pile Up
Premium Section: How to Trade this Current Market
This week, we’ll review mounting warning signs in the market and the deteriorating conditions we're observing. In the Premium Section, we’ll reveal what we believe is the best strategy for trading in the current market.
New Offer: From now until November 2nd, we are offering the Complete 4Q2024 Cycle Forecast Set (worth $75) to all new Yearly subscribers for FREE. This set includes Cycle Forecasts for Indexes, Sectors, the Magnificent 7 stocks, Commodities, and Cryptocurrencies. The offer is also available to those upgrading from a monthly subscription onto the yearly subscription.
Increasing Warning Signs
Primary Cycle Warning: Warning signs are piling up in the market. The first comes from our daily chart’s Primary Cycle bracket, shown below. We're entering the last quarter of the cycle bracket, a period when the S&P 500 (SPY) typically sells off, possibly into the November 15th timeframe. This aligns with the expected weakness from the 60-Year Cycle we discussed last week. Last Wednesday, the Half-Cycle SMA (blue) was tested, but if it doesn’t hold, the next stop is the Primary Cycle SMA (green) at $566, which is around 3% down from the high. If SPY continues lower, the 50-Week SMA (purple) is at $549, representing a 6.35% decline from the high. There is a low probability chance that the 4-Year Cycle SMA (orange) gets touched at $473 which is 20% lower.
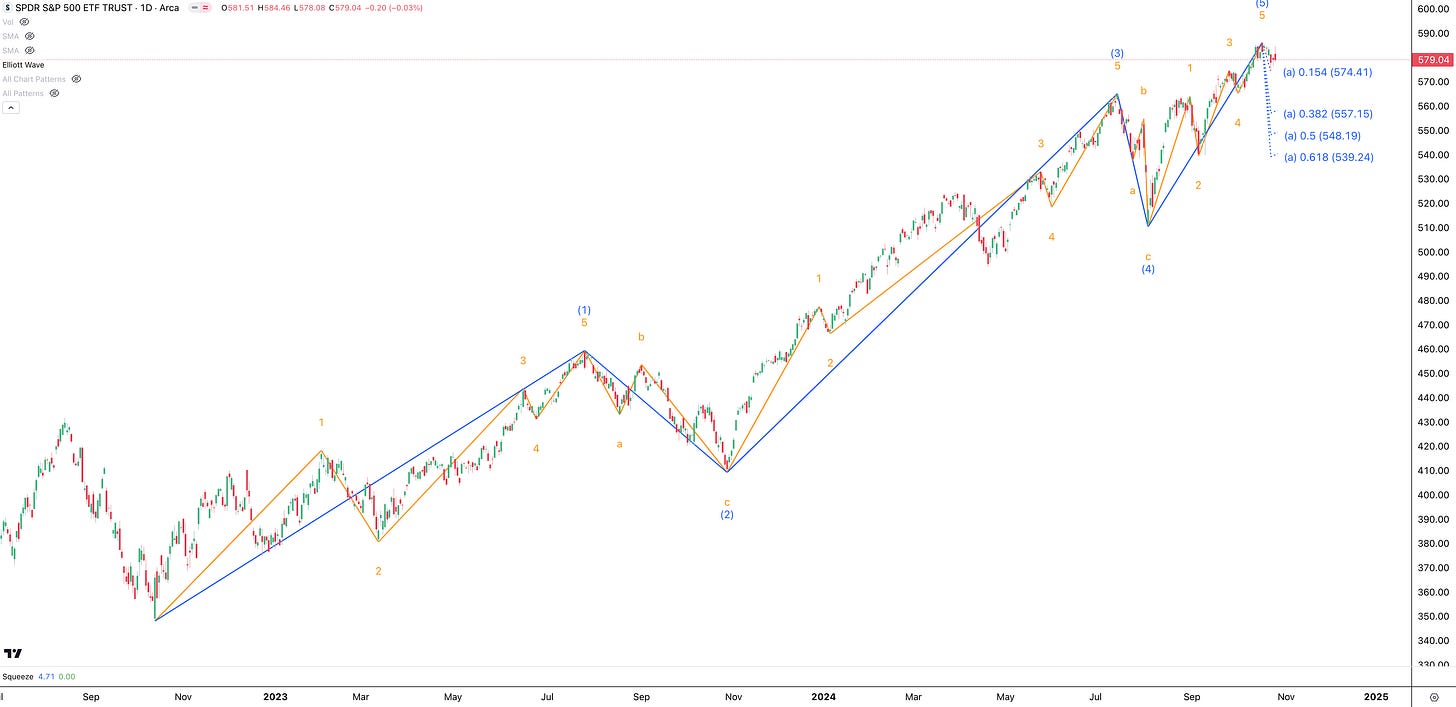
Elliott Wave Warning: Elliott Wave practitioners are cautioning that the market's up-phase may be nearing its end, signaling a potential shift into a corrective phase. For those unfamiliar with Elliott Wave, you can read about it here. According to Elliott Wave Theory, the SPY may be completing the 5th Wave of a 5th Wave, completing the up-cycle that started in October 2023. What would follow is an “ABC” corrective pattern lower and the first leg down (A Wave) could go down from $574 to $539.
Intermarket Warning: Intermarket Analysis practitioners may find recent market dynamics unusual. Stocks have been climbing while bonds decline, diverging from the typical pattern where bonds act as a leading indicator for equities. Since mid-to-late September, Treasury Bonds (TLT), Corporate Bonds (LQD), and High Yield Bonds (HYG) have all trended down as the SPY moves higher. If this Intermarket relationship continues to hold weight, it could signal an early warning of a potential stock market downturn in the near future.
The MOVE Index, a measure of volatility in fixed income, recently spiked, raising the likelihood of a credit event. Bond traders are often considered the 'smart money' compared to equity traders. So, we have to ask: what do they see that we don’t?
Market Conditions: Weakening Conditions
The S&P 500 (SPY) cannot seem to break above the R1 Pivot Point at $585.83, which is now acting as heavy resistance. It is still above the 21 EMA so the uptrend is still intact, but it is below the 9 EMA which may signal weakness. Meanwhile breadth is deteriorating significantly. Notice that the Net New Highs are at a lower level, as the McClellan Breadth Oscilator remains negative. What is surprising is that the Percent of S&P 500 Stocks Above the 20 SMA (S5TW) has declined significantly. This selloff in individual stocks is occurring as the VIX (volatility) increased above the 20 mark, which is a warning signal for professional portfolio managers to reduce risk exposure. The VIX Curve (VXV/VIX) is also moving lower, telling us that near term volatility may be increasing. Sharp selloffs often occur when the VIX Curve falls below 1.0, however we are not there yet. This tells us to prepare for some Election Day volatility. Finally the Put/Call ratio is still very bullish, which could lead to some downside action in the future.
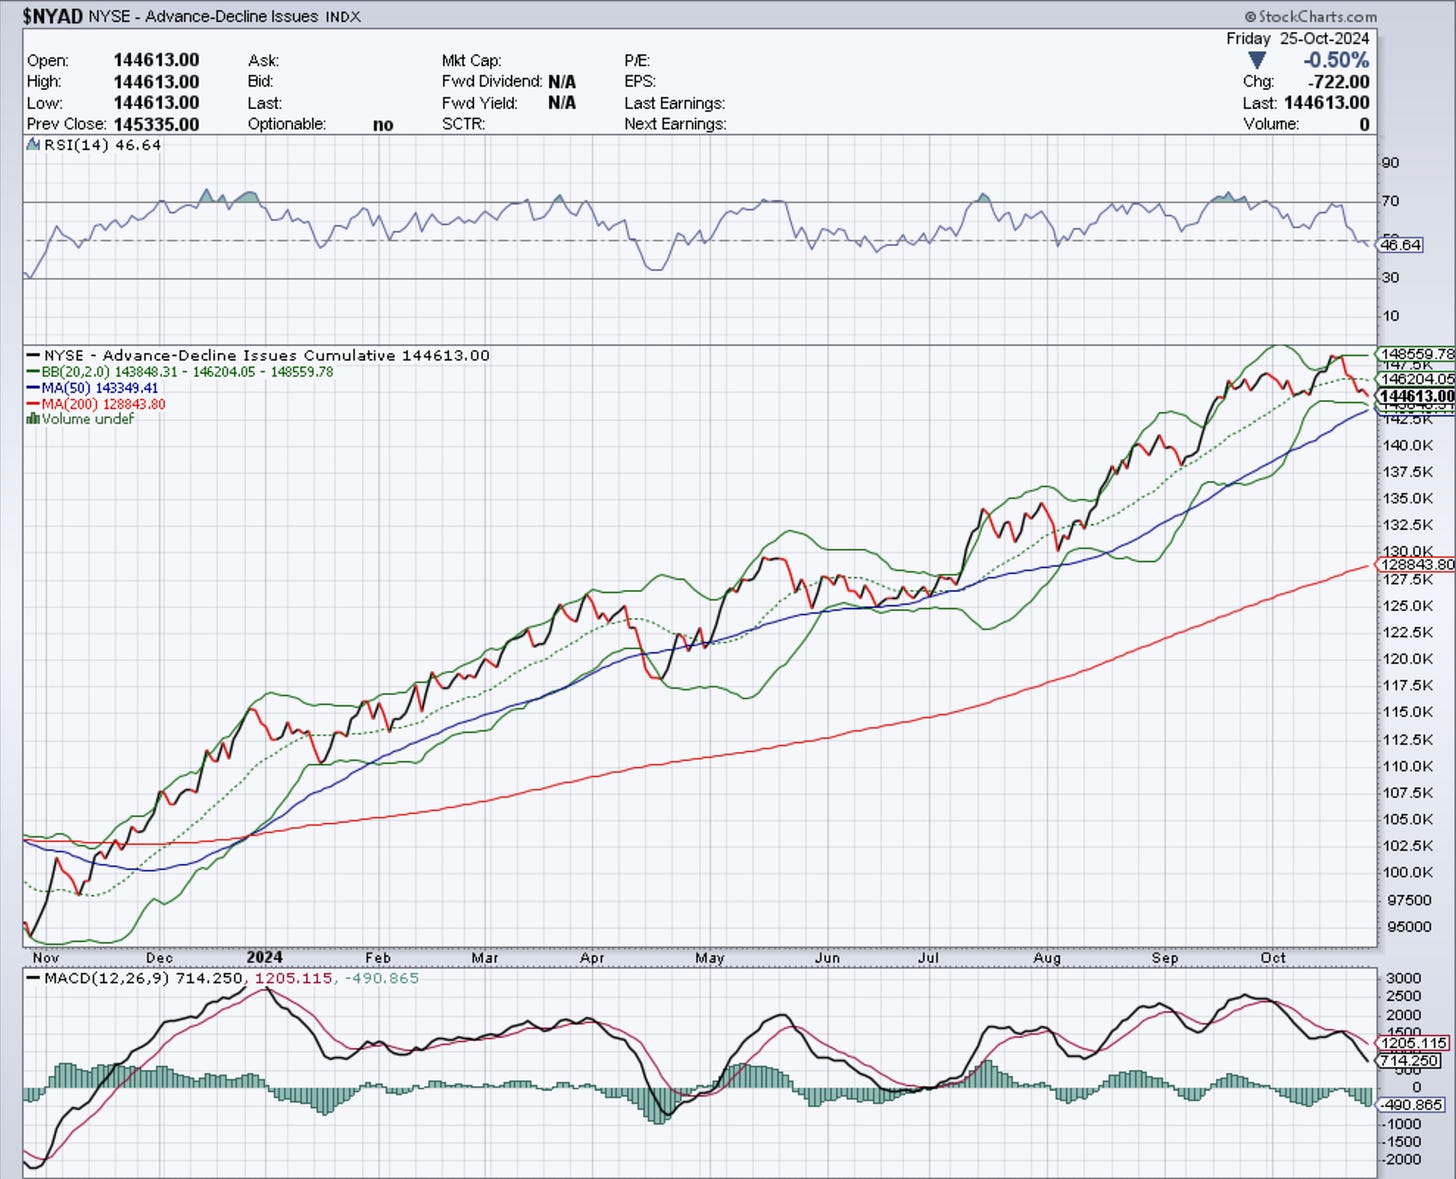
The NYSE Advance/Decline Line ($NYAD) was rejected at the Upper Bollinger Band and is now heading toward the Lower Bollinger band, which also has confluence with the 50 SMA (blue). Some more downside is expected, however at the moment a bounce should be expected at the aforementioned confluence zone.
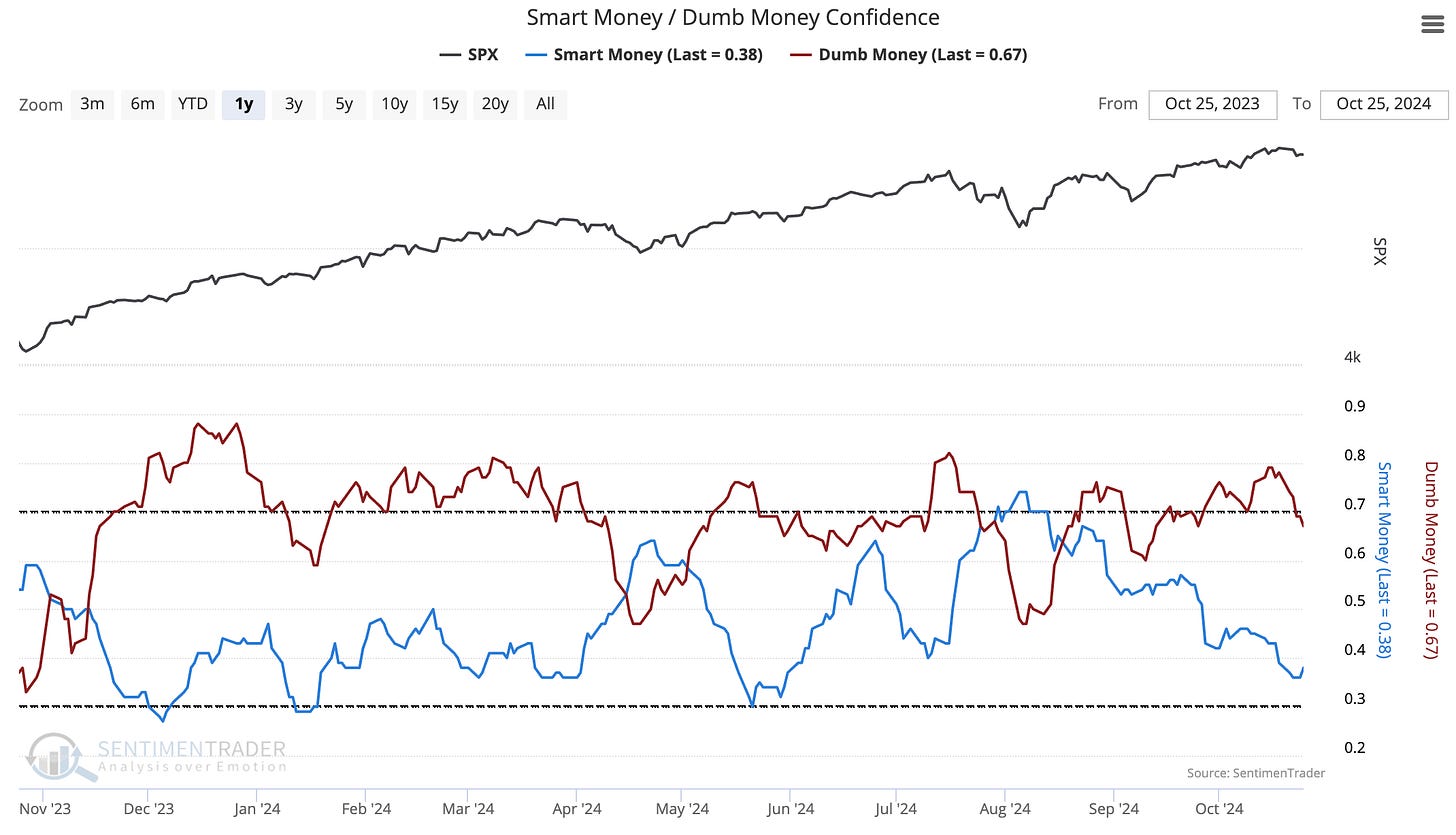
Dumb Money is selling out, as Smart Money begins to buy. If Dumb Money continues to sell or get stopped out, the market could downshift to the next support level.
Right now the late September high as been support at $574.71. if this level breaks, the next support level is $565.16, which is the August high. It also has some confluence with the 50 EMA at $567.67.
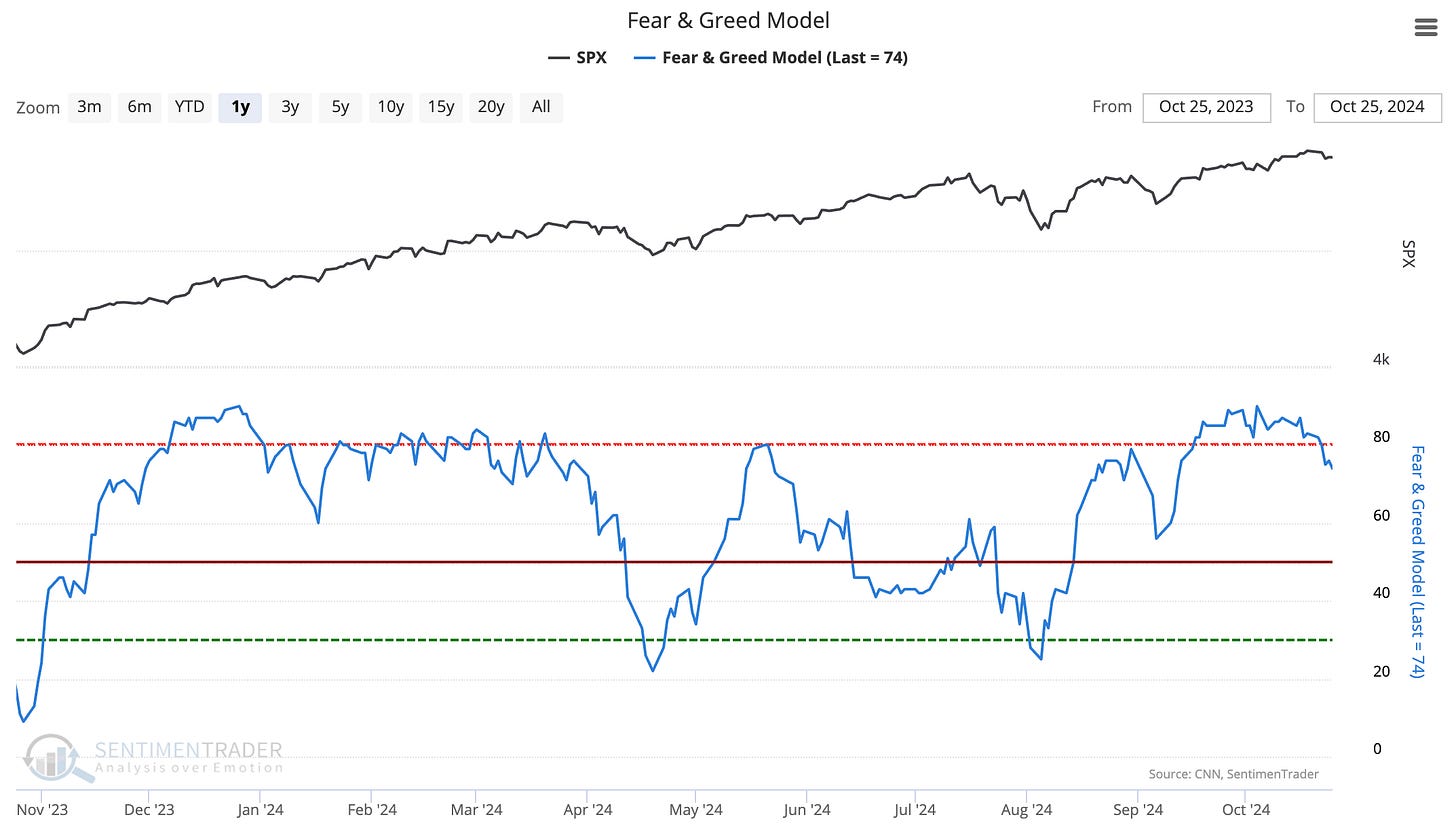
Finally Fear is starting to creep into the market. If Fear continues to grow it could easily pull the market lower.
Next Week…
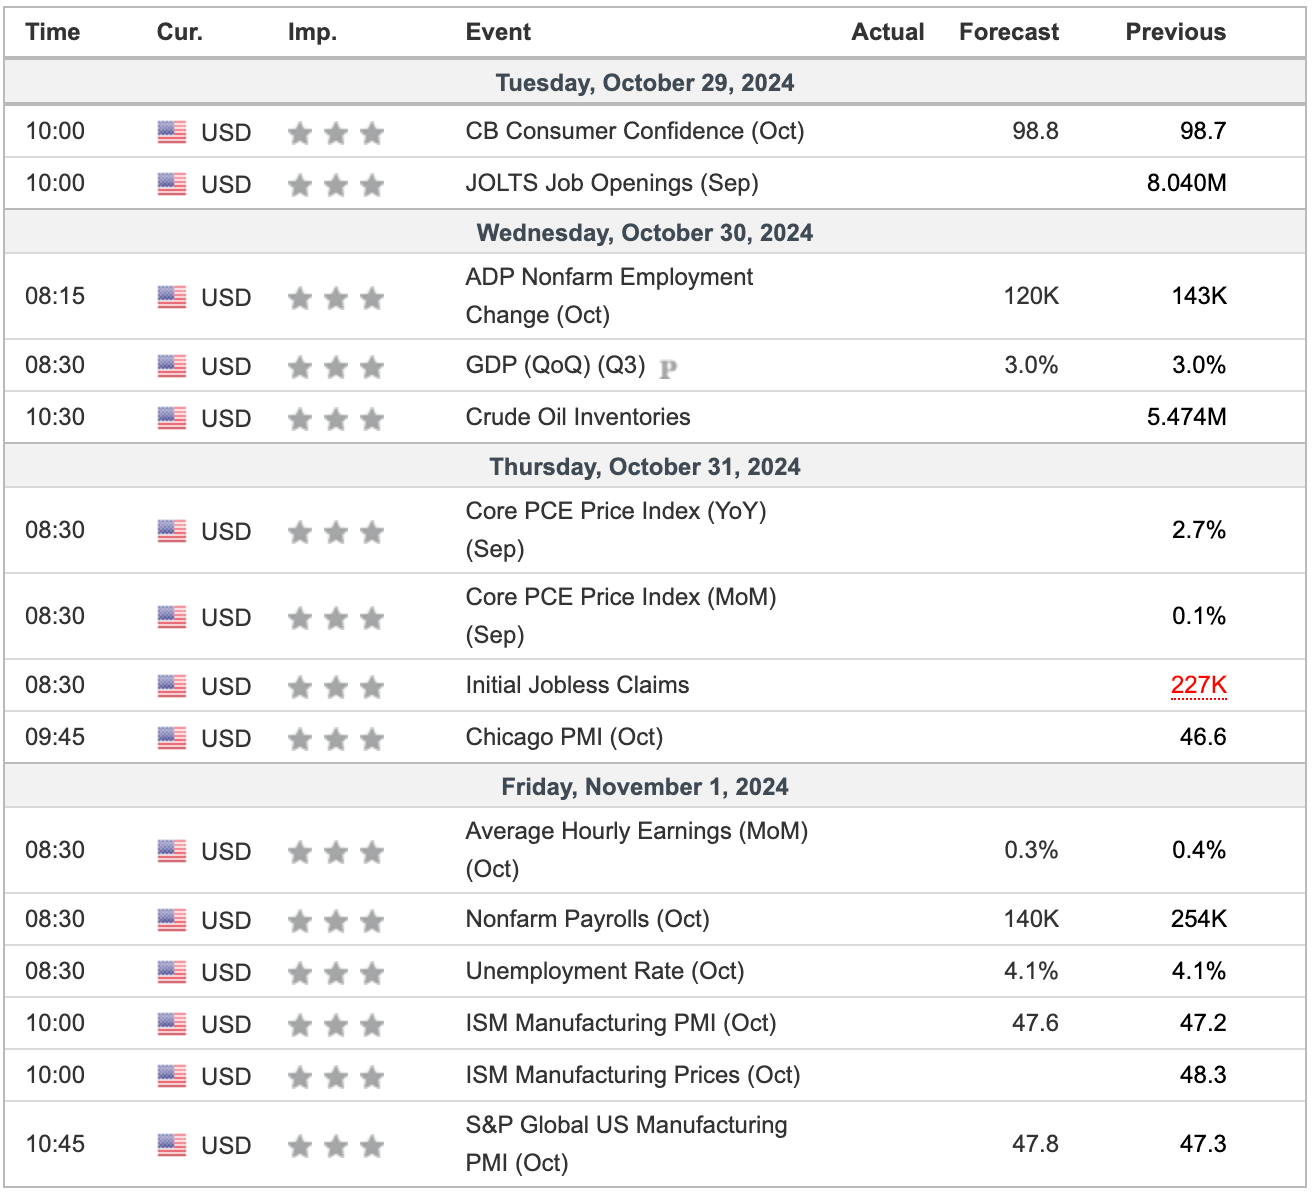
Next week will bring a lot of economic data releases, likely driving increased volatility and clearer market direction. Key reports include GDP on Monday, Core PCE on Thursday, and the most critical—Nonfarm Payrolls and the Unemployment Rate on Friday.
Next week will be significant for Megacap earnings, which could move the market. On Tuesday, 10/29, AMD, GOOGL, and V report after the close. On Wednesday, 10/30, LLY reports before the open, with META and MSFT following after the close. On Thursday, 10/31, MA, MRK, and SHEL report before the open, while AAPL and AMZN report after the close. Finally, on Friday, 11/1, CVX and XOM will release their earnings before the open.
For serious traders, be sure to read the Premium Section, where we’ll discuss what we believe is the best trading strategy for the current market environment.
Disclaimer - All materials, information, and ideas from Cycles Edge are for educational purposes only and should not be considered Financial Advice. This blog may document actions done by the owners/writers of this blog, thus it should be assumed that positions are likely taken. If this is an issue, please discontinue reading. Cycles Edge takes no responsibility for possible losses, as markets can be volatile and unpredictable, leading to constantly changing opinions or forecasts.


