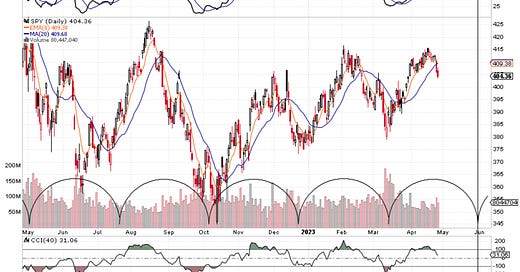
The uptrend is over. This is evidenced by the price of the SPY cracking down below the 20 simple moving average (blue line in chart below). There were early warnings such as: 1) The NYSE Advance Decline Line Oscillator ($NYAD) hit the overbought line and rolled over, 2) the Bullish Percentage of SPX Stocks ($BPSPX) stopped going up and finally fell below the 20 SMA, and 3) price stalled at the R2 Pivot Point (not shown to make the chart look clean). After the vicious past two trading days, where the S&P 500 lost around 2%, the CCI indicator started a downtrend from overbought levels and the MACD made a bearish crossover. The Spring Rally is over, and a weak one it was, hindered by a troubled macro backdrop.
As confirmation, the NYSE McClellan Summation Index fell into a downtrend as the Parabolic SAR flipped. The RSI indicator also confirms the downwards direction.
Finally the Smart Money / Dumb Money Confidence indicator once again shows how Smart Money sold to Dumb Money, and when Dumb Money starts selling, the market goes down.
So where do we go from here? The last two trading days left the SPY short-term oversold as per the 5-day RSI indicator. It is possible that it continues lower to test the 50-day SMA at $401.70, before it bounces back to retest the 8 EMA at $409.38. It is also possible that the bounce back to the 8 EMA begins tomorrow. Finally a rally back up to form a double top is also a possibility, but given the recent weakness, this is a lower probability. We’ll see what happens, but traders should have a plan for all scenarios. Looking at the cycle brackets (black loops) this current downtrend could last until May 31st. I plan to go back into Protection Mode, where I limit overnight positions, sell call options or call credit spreads and day trade. In all cases, capital protection is the name of the game right now.
Disclaimer: This is for educational purposes only. This is not financial advice. For official financial advice, please consult your financial advisor.


Very nice concise analysis.