


Why So Negative?
Bad enough to cause a 1987-type crash?

Did you ever have a friend that was so negative, you just can’t talk to them anymore? Well, that is a pretty good analogy for the financial markets this past week…there is so much negativity investors just don’t want to deal with it right now. There is a terrible new war in Israel, which can shake up fragile geopolitical relations. Inflation is ticking up again as oil prices rise. This results in interest rates climbing higher putting more pressure on the real economy, and real estate, while also creating a downward pressure on valuations (P/E ratios). The aforementioned cocktail of negativity drove the drop in stocks last week.
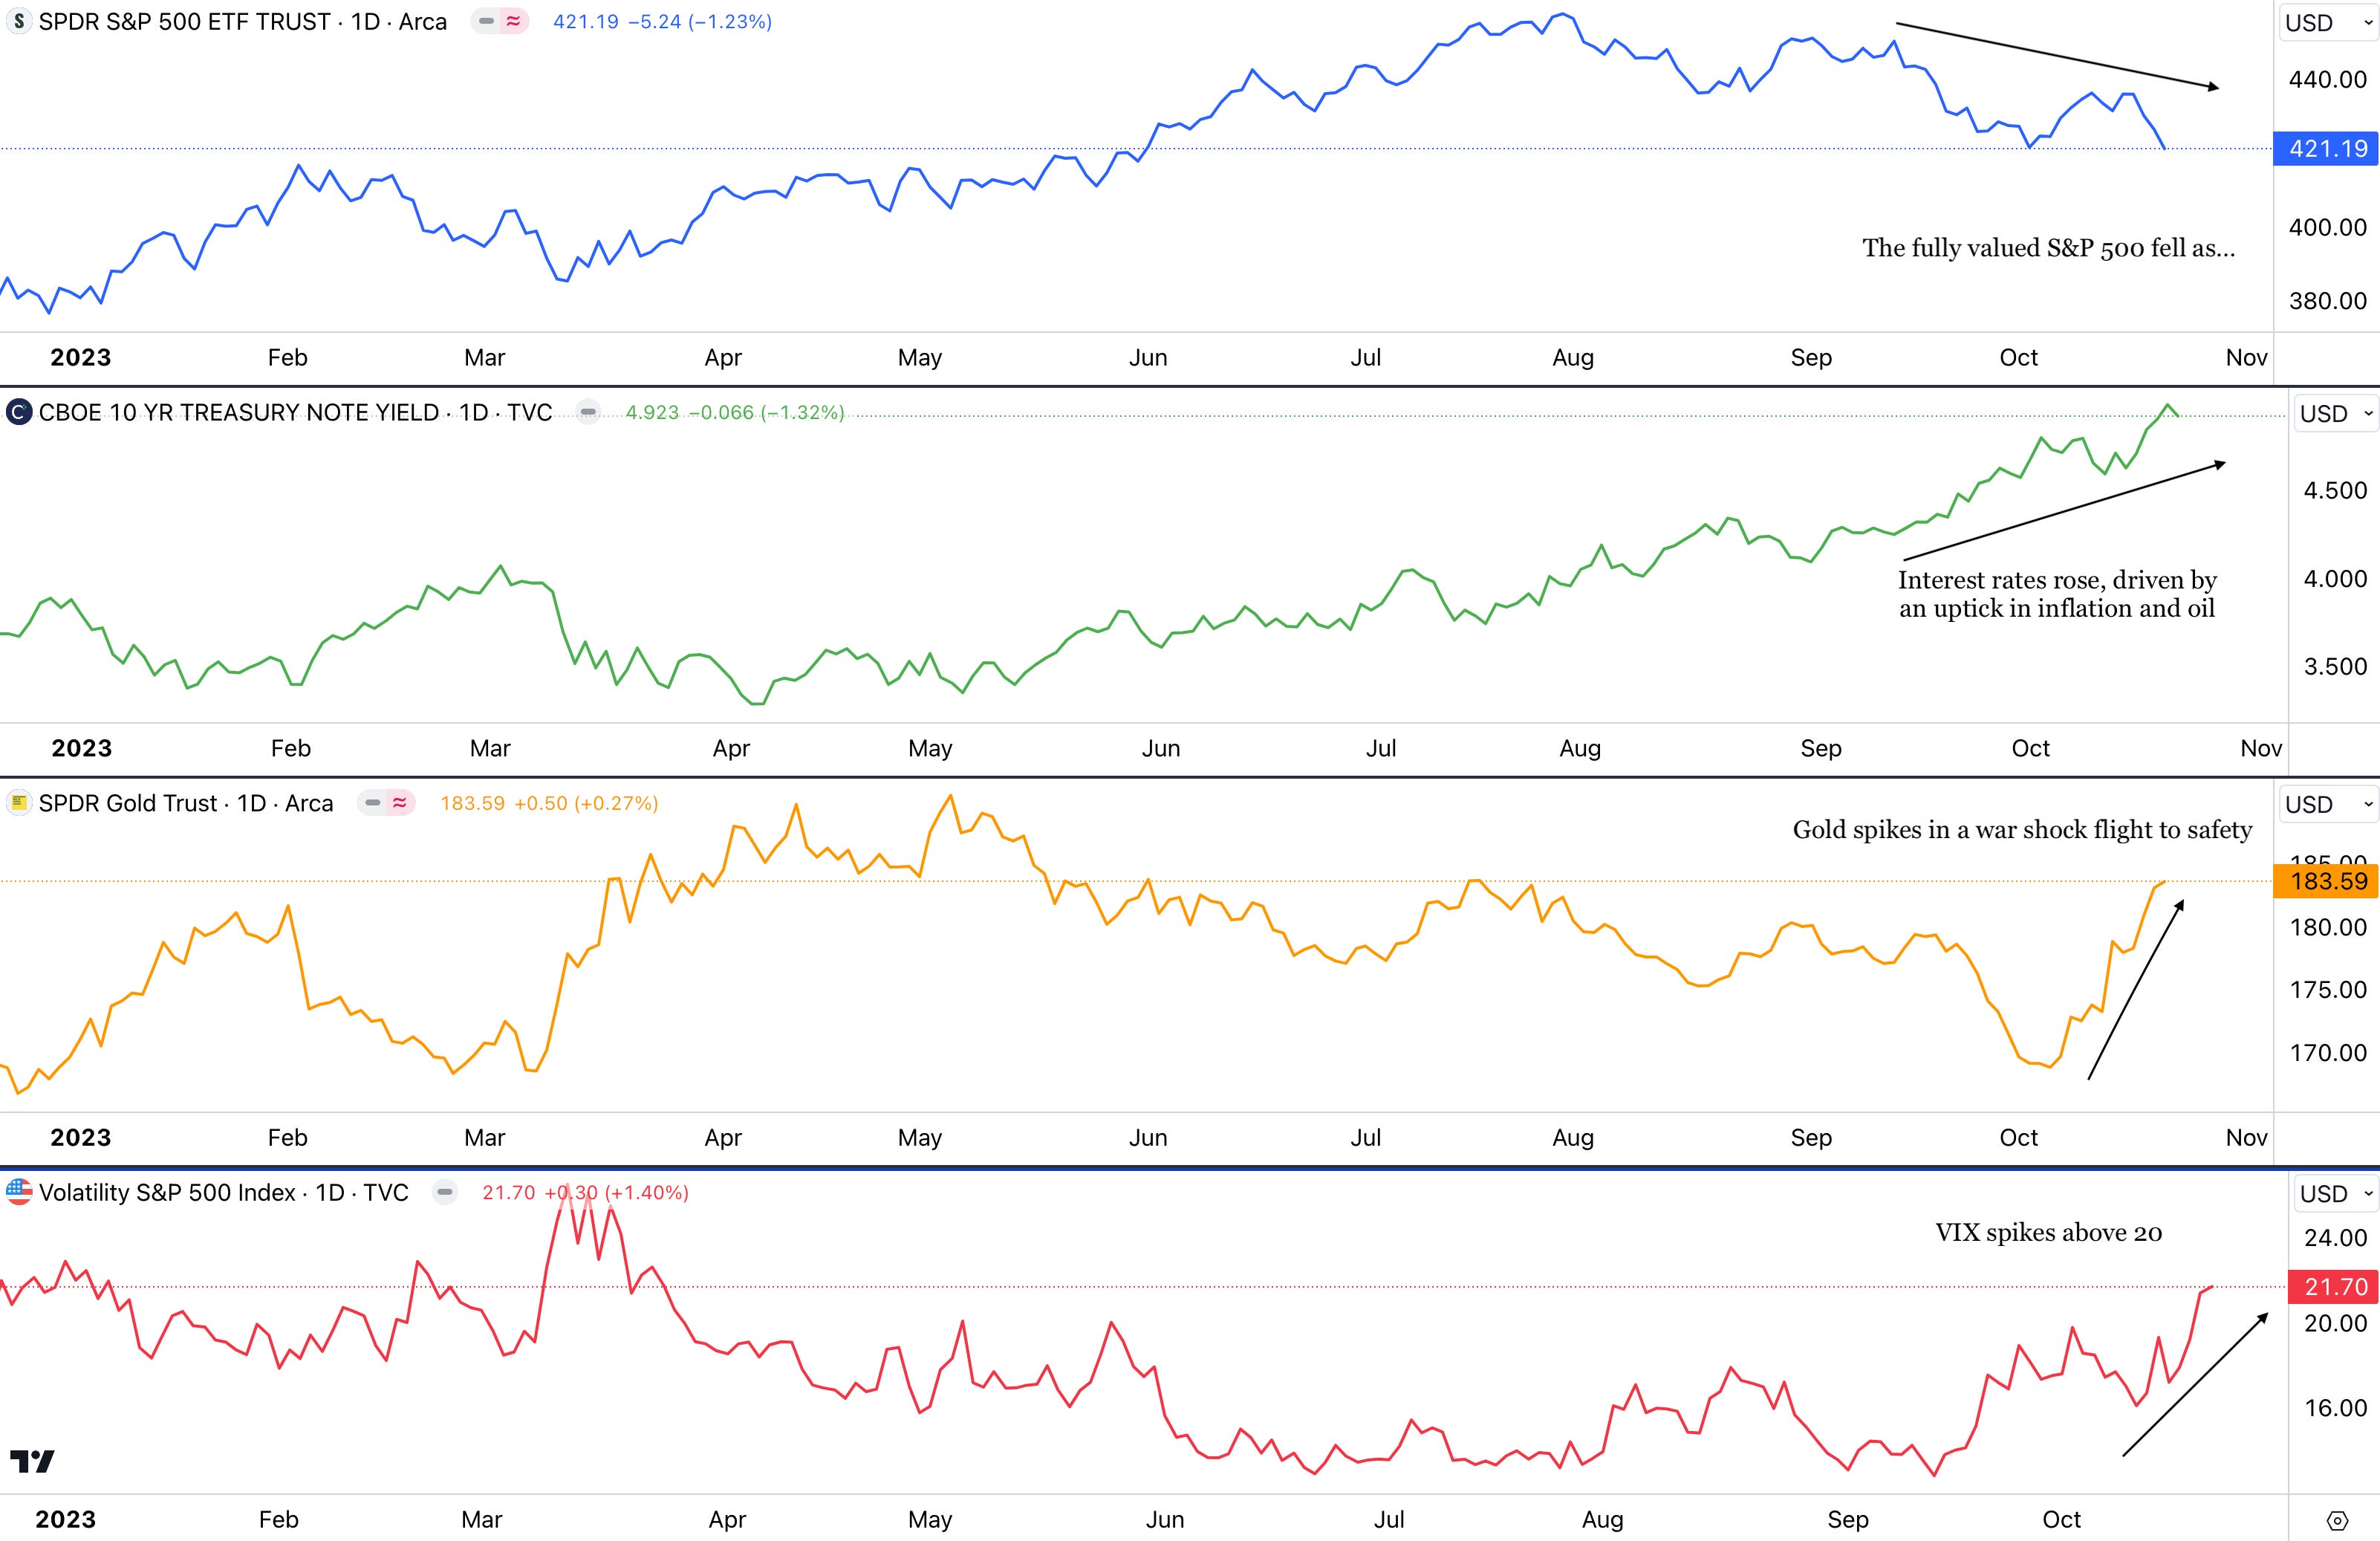
Gold trades in two ways:
1) Inverse treasury yields (yields go up, gold goes down) or
2) War shock causing a flight to safety
Despite rising rates, gold is spiking up due to the war shock effect. This could be seen as a sign of negativity or fear in the market. This is confirmed by the spike in the VIX above 20.
On top of that, the S&P 500 is not cheap at $4,224 with a forward price-to-earnings ratio (F P/E) of 17.5x (assuming forward earnings of $241.35). If the F P/E ratio fell to 16.5x it would imply a price of $3,983, roughly a 6% drop. At 16x it would imply a price for the S&P 500 of $3,861 roughly a 9% drop. These F P/E levels are important as the market traded to these ratios in 2022 before finding dip buyers.
Yes, if that friend starts to put on a happy face and stops turning every conversation negative, you might want to reconnect. The seasonal start of the year-end rally is upon us, but is stalling due to the negative situations the world and market are facing. We’ll see if the expected year-end rally will begin to take shape soon.
Technical Analysis:
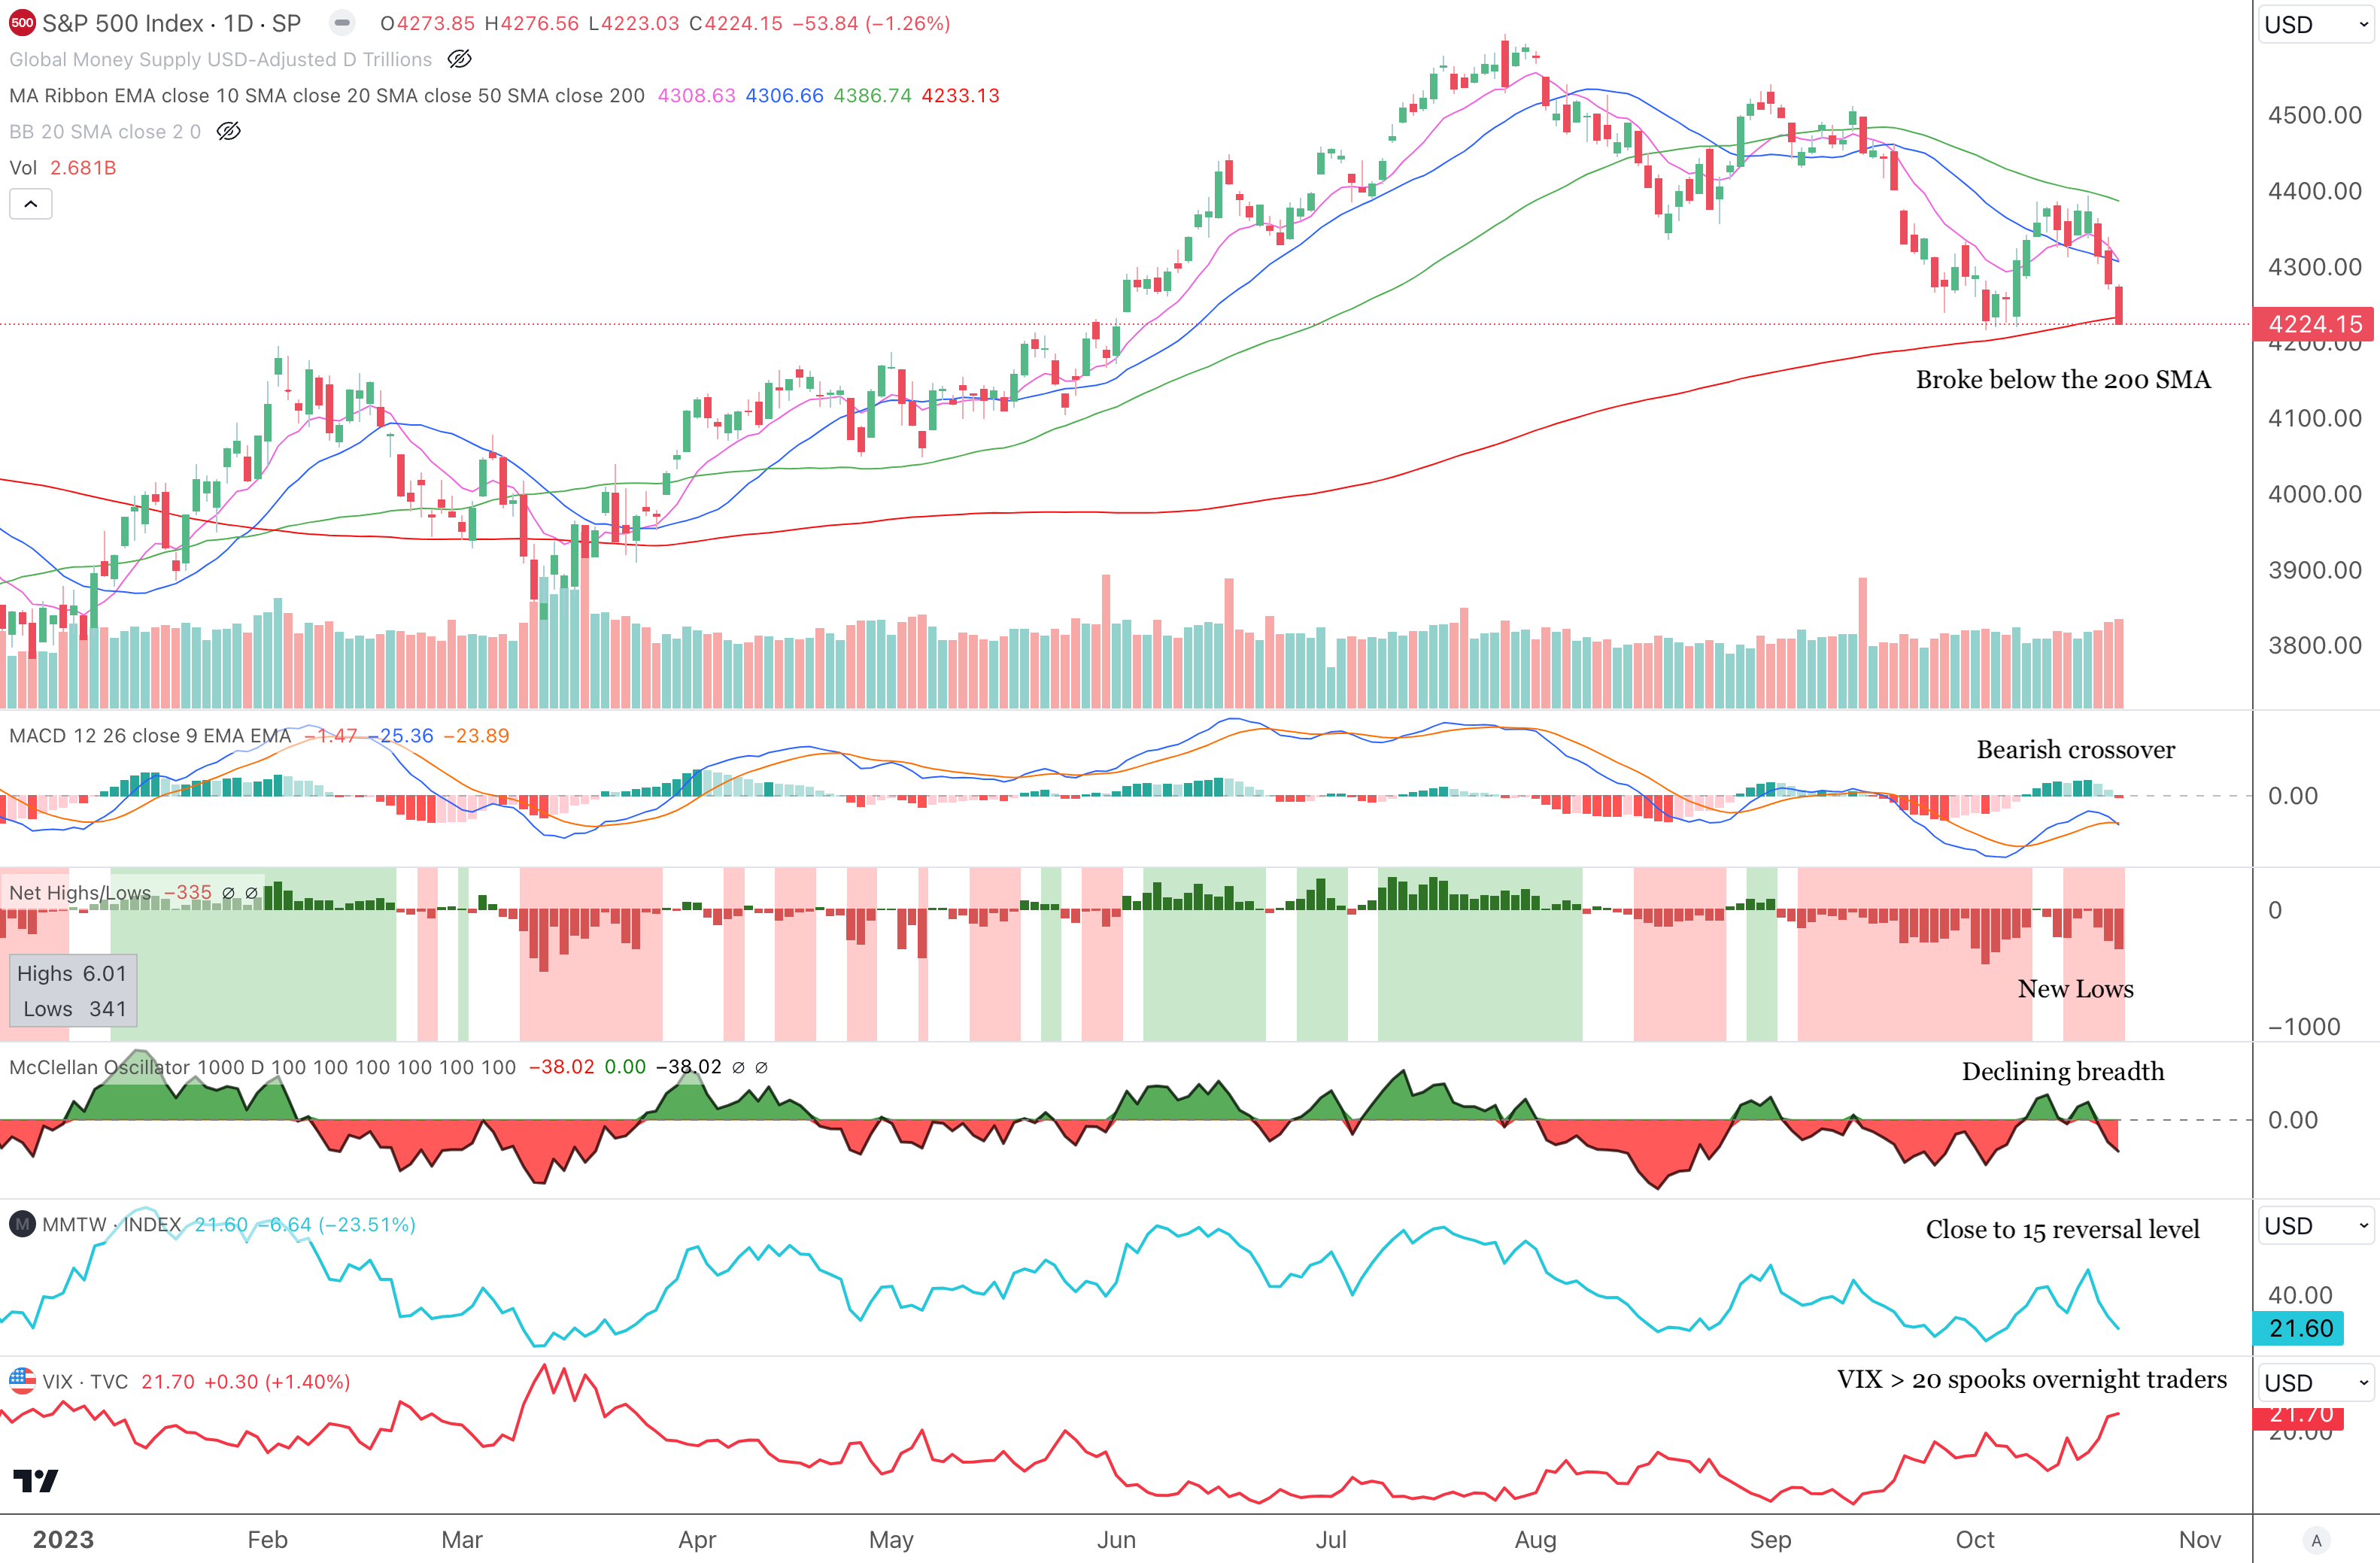
In one look you can say that the market is ugly. On the Daily chart, the S&P 500 (SPX) broke below the 200 SMA, which many market technicians use as a line in the sand (bullish above, bearish below). Price is below all moving averages, and thus the trend is negatively configured. The MACD indicator made a bearish crossover, while the market has accelerated net new lows. The McClellan Oscillator confirms declining breadth. This is definitely not a Swing Trader’s Market, meaning it is not a good environment that supports higher prices and making money on the long side. The VIX has spiked over the 20 level, which is a warning sign for many traders to reduce their overnight exposure. On the bright side, the percentage of SPX stocks above the 20 SMA (sky blue line below) is nearing the 15% mark, which has been known to be a reversal area.
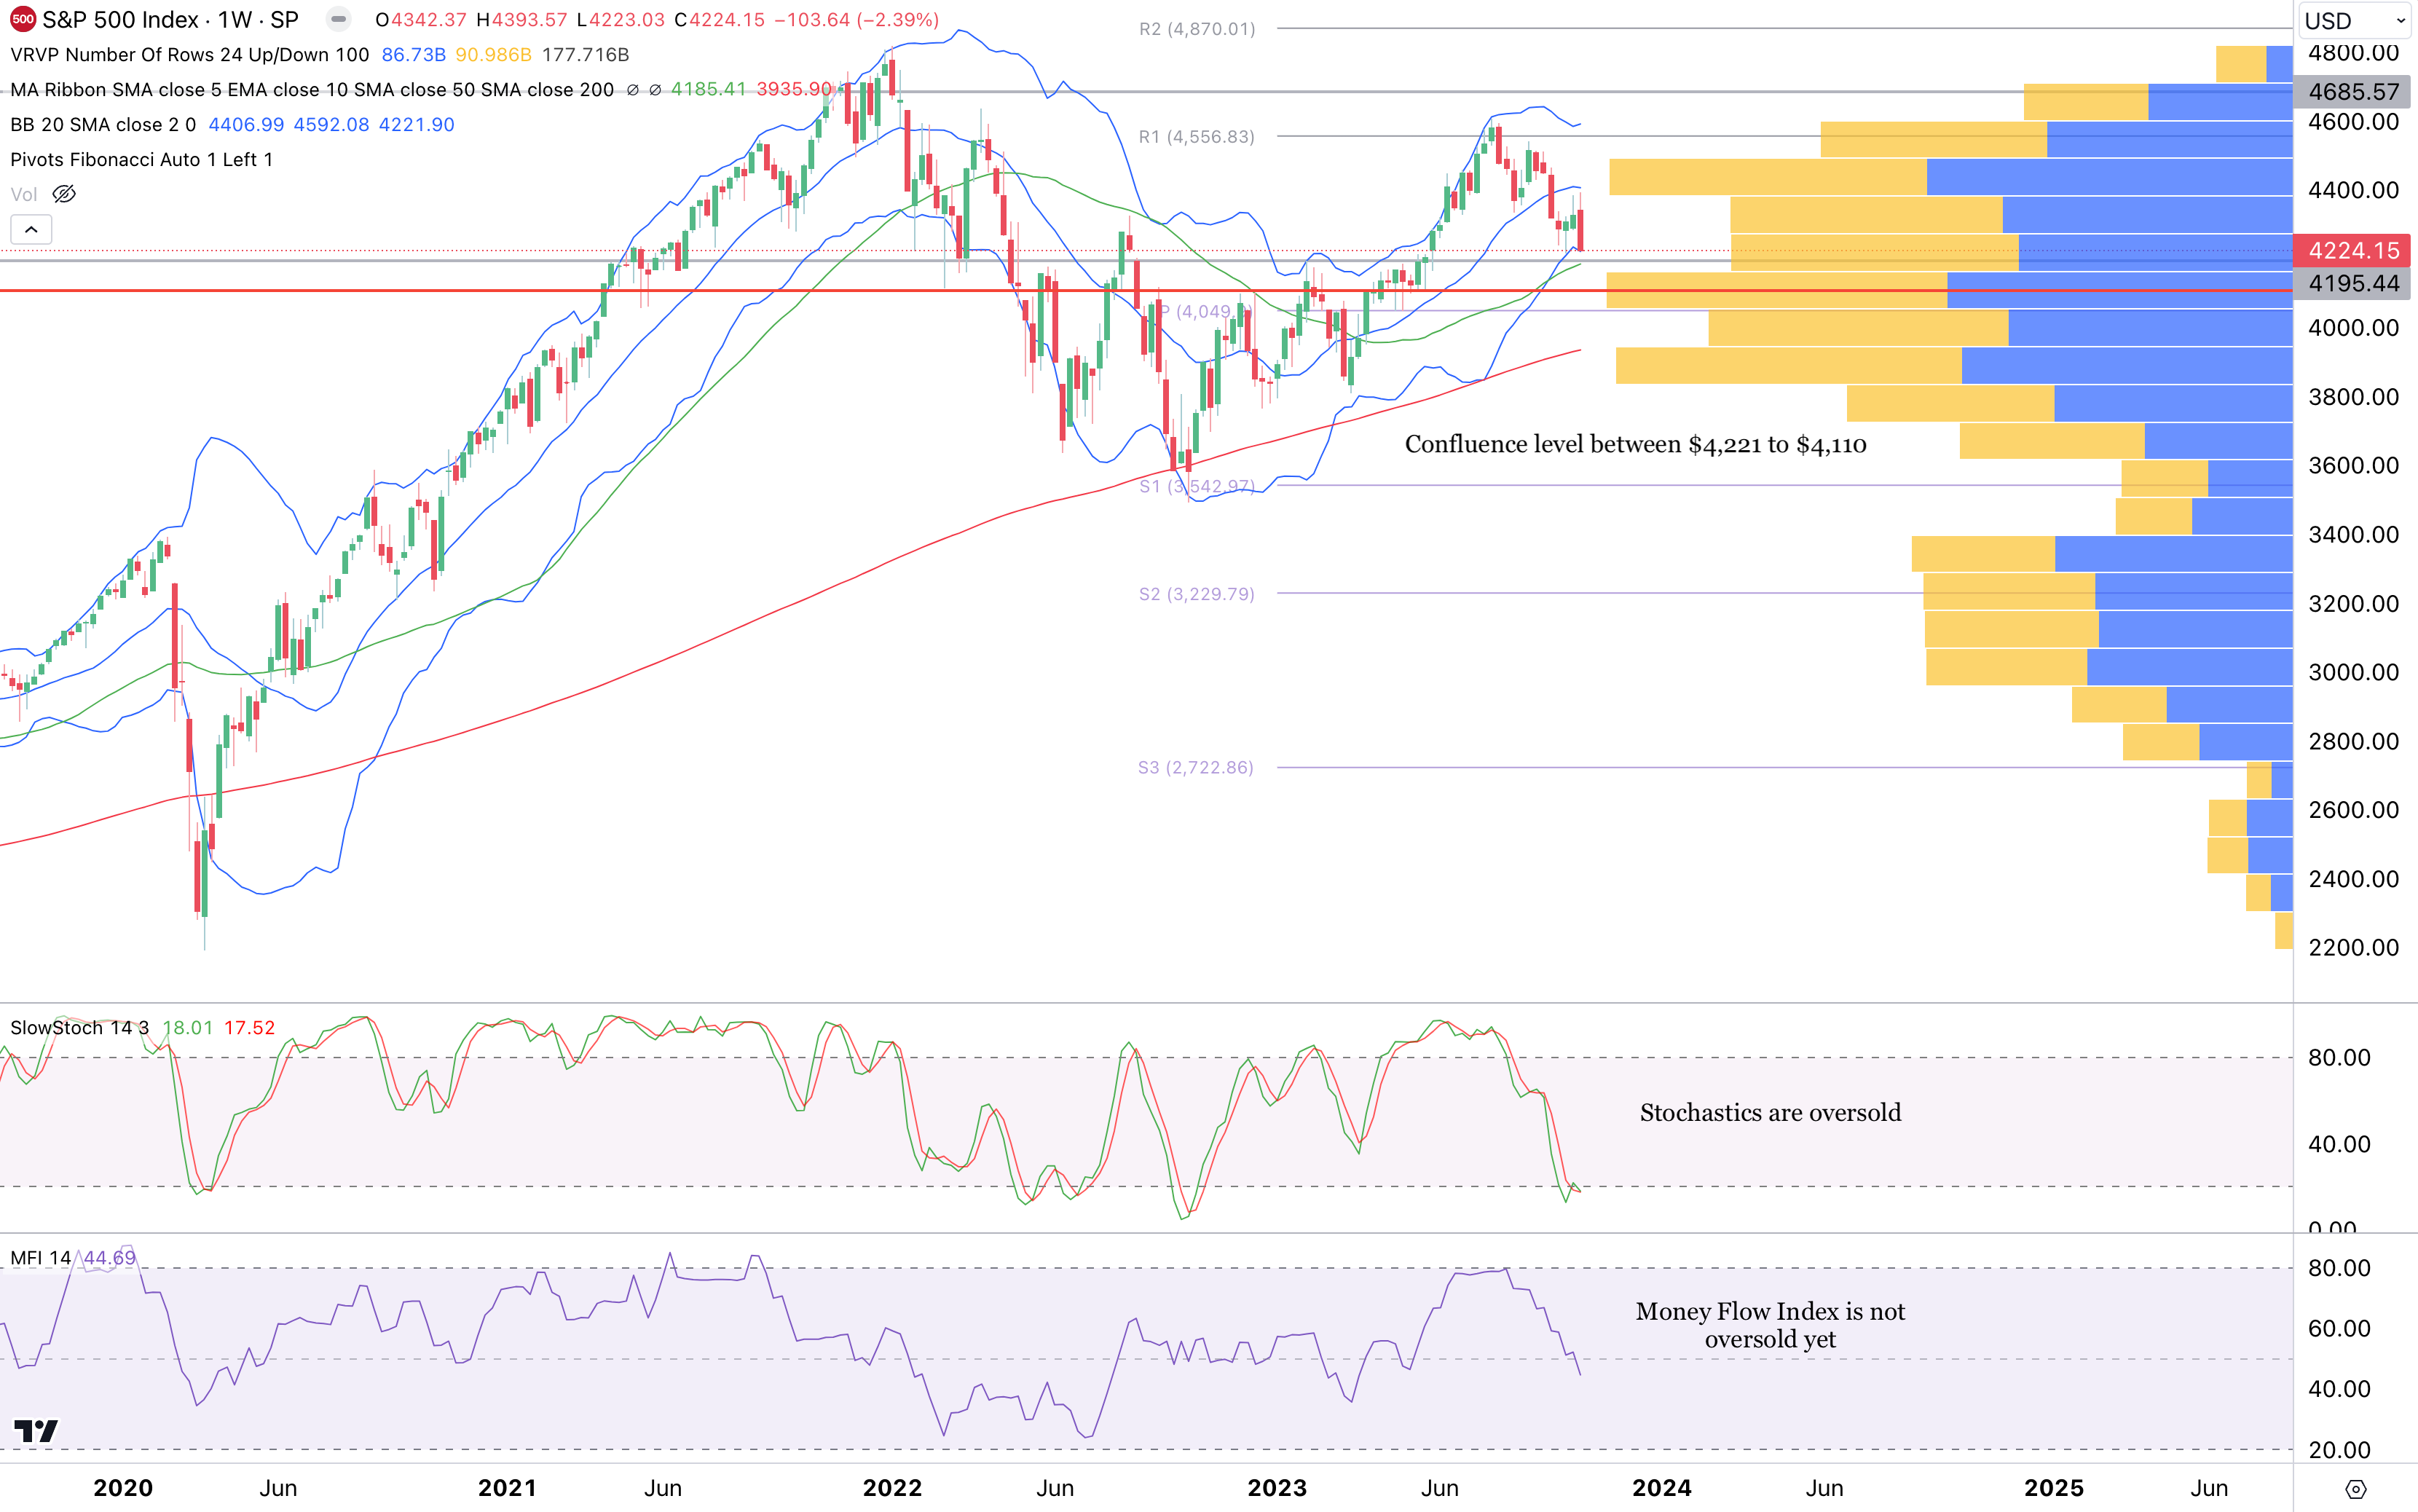
Looking at the weekly chart below, we can see a few areas of possible support. The lower Bollinger band, 50-week SMA and prior support level from May 2023 form a confluence support zone around $4,190. If that breaks, the Volume Profile Point of Control (levels where most shares were traded) is around $4,110, close to the yearly Fibonacci Pivot Point at $4,050. Finally, the 20-week SMA could provide support at $3,936.
The bottom line on technicals is that we need to see a real show of strength to make us believe the market has enough gas to start a new uptrend. A strong bounce above the 200 SMA on the daily chart with high volume would be the first positive signal. Until that happens, they say bad things can happen when price is below the 200 SMA.
Market Internals:
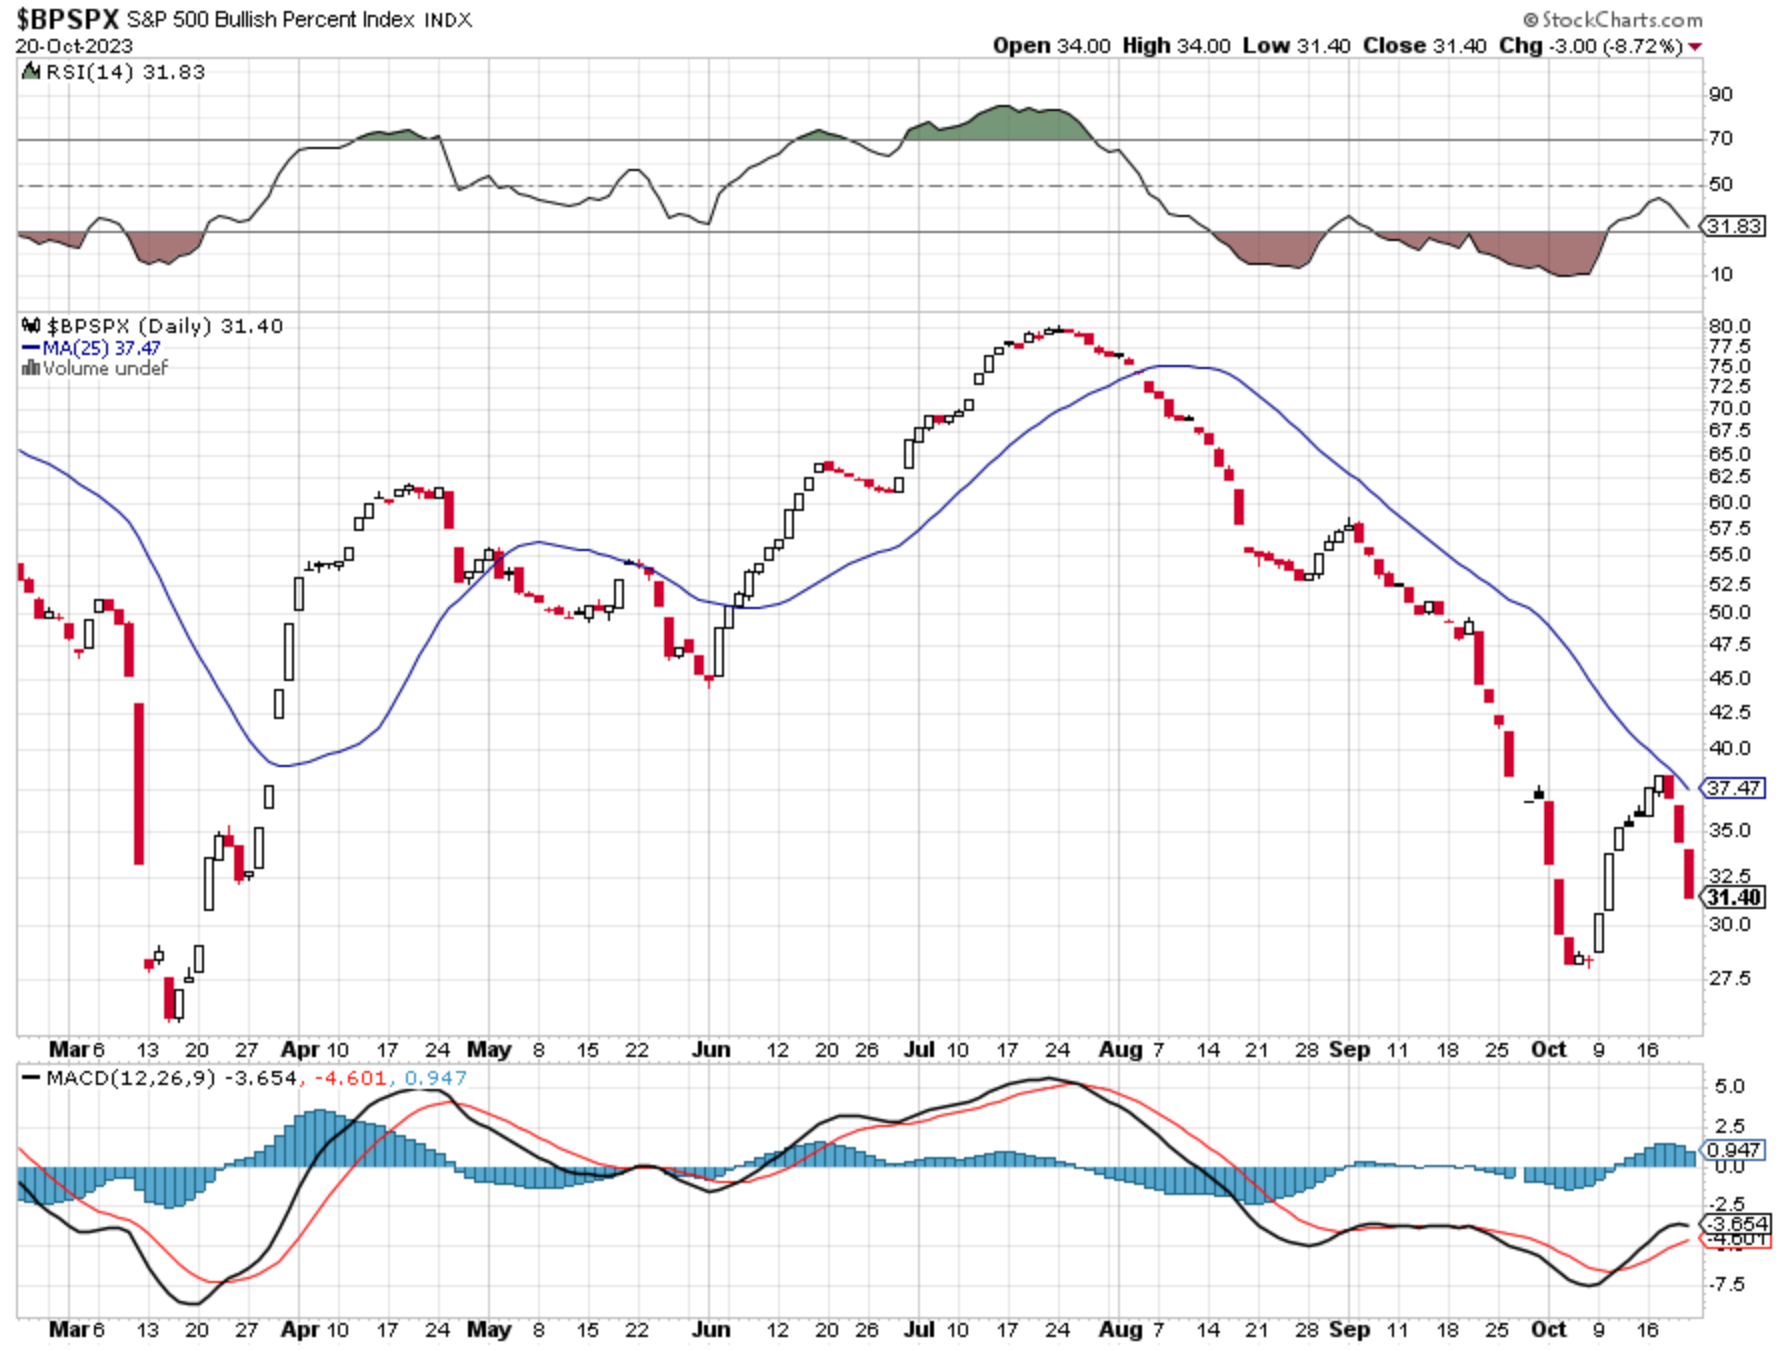
The Bullish Percent of S&P 500 stocks (BPSPX) breadth indicator started to rebound from oversold conditions but hit the 25-day SMA and fell apart. Oversold conditions could stay oversold for a while.
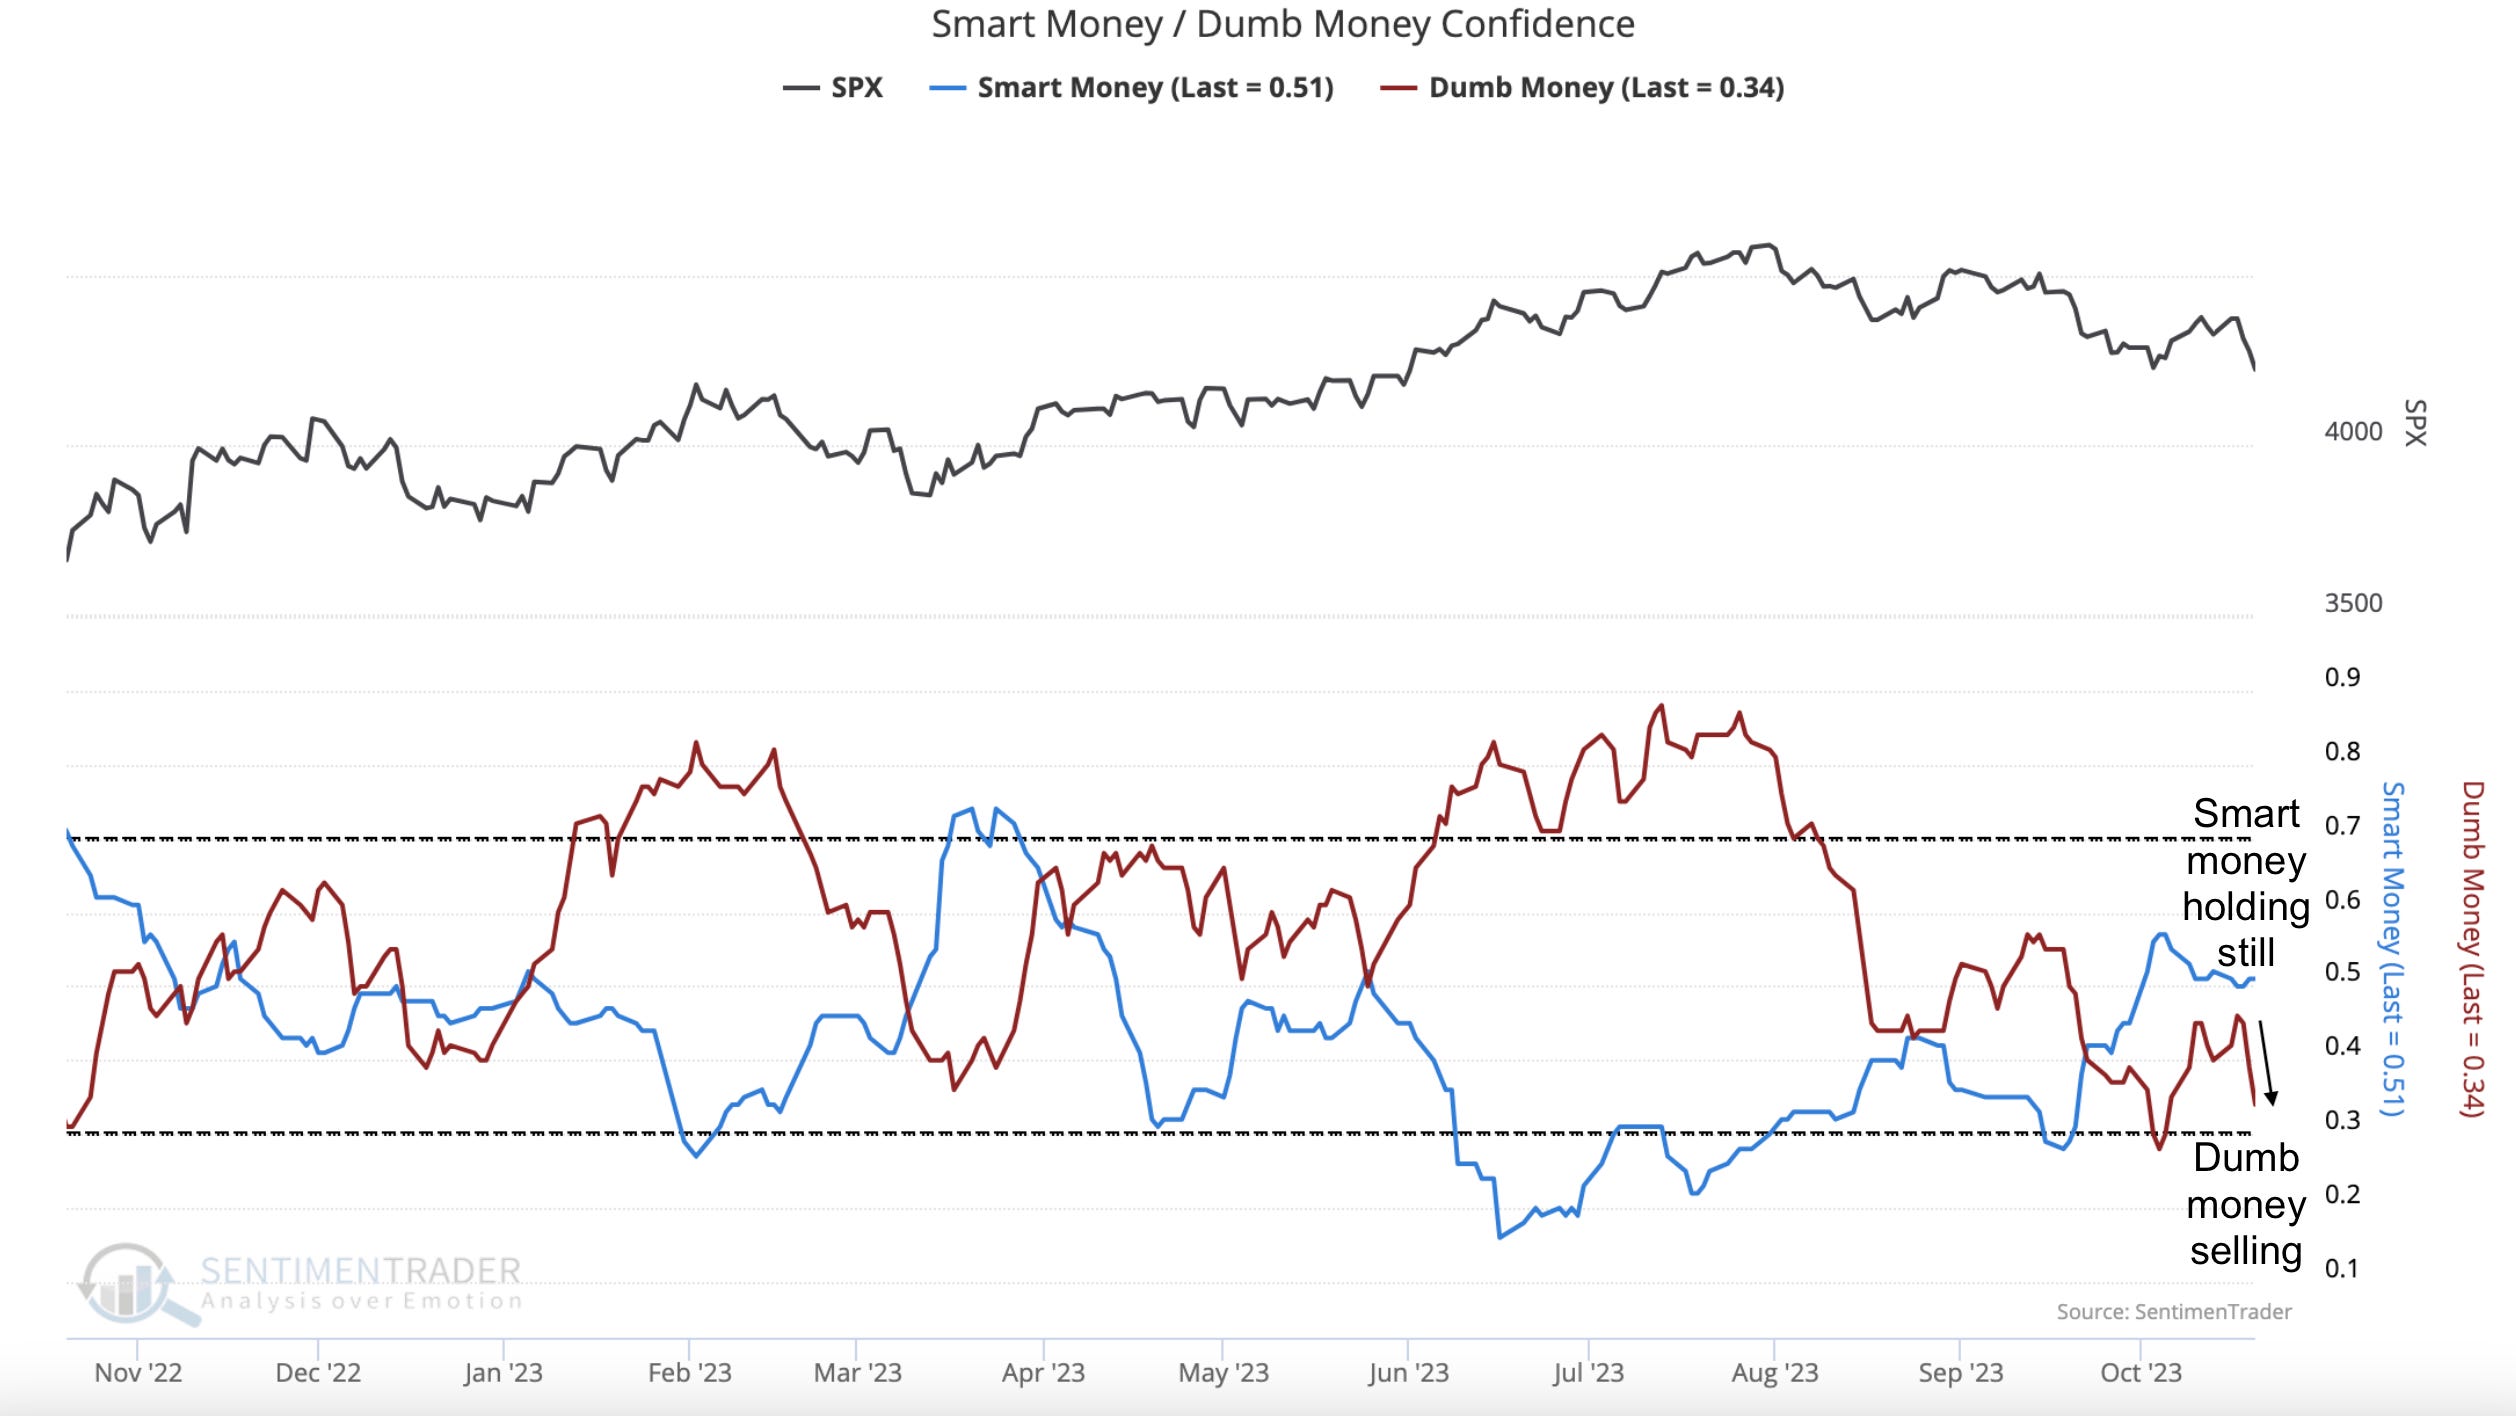
The chart below shows that it was mostly retail (Dumb Money) selling last week and not the Smart Money. Instead, Smart Money appears to be patiently waiting for an opportunity to add exposure
Cycles:
There is a lot of talk on Twitter saying that the stock market is matching the price action of the 1987 October Crash. If so, then the crash should happen soon. Black Monday occurred on October 19, 1987, the Monday after options expiration. That would be today i.e., Monday, October 23, 2023. Note that the market bottomed the next day on October 20, 1987. This could hint that even if there is some more downside left, the hour is getting late, and the time window could close soon. If we are following the 1987 analog, then the drop was followed by a 19% rebound.
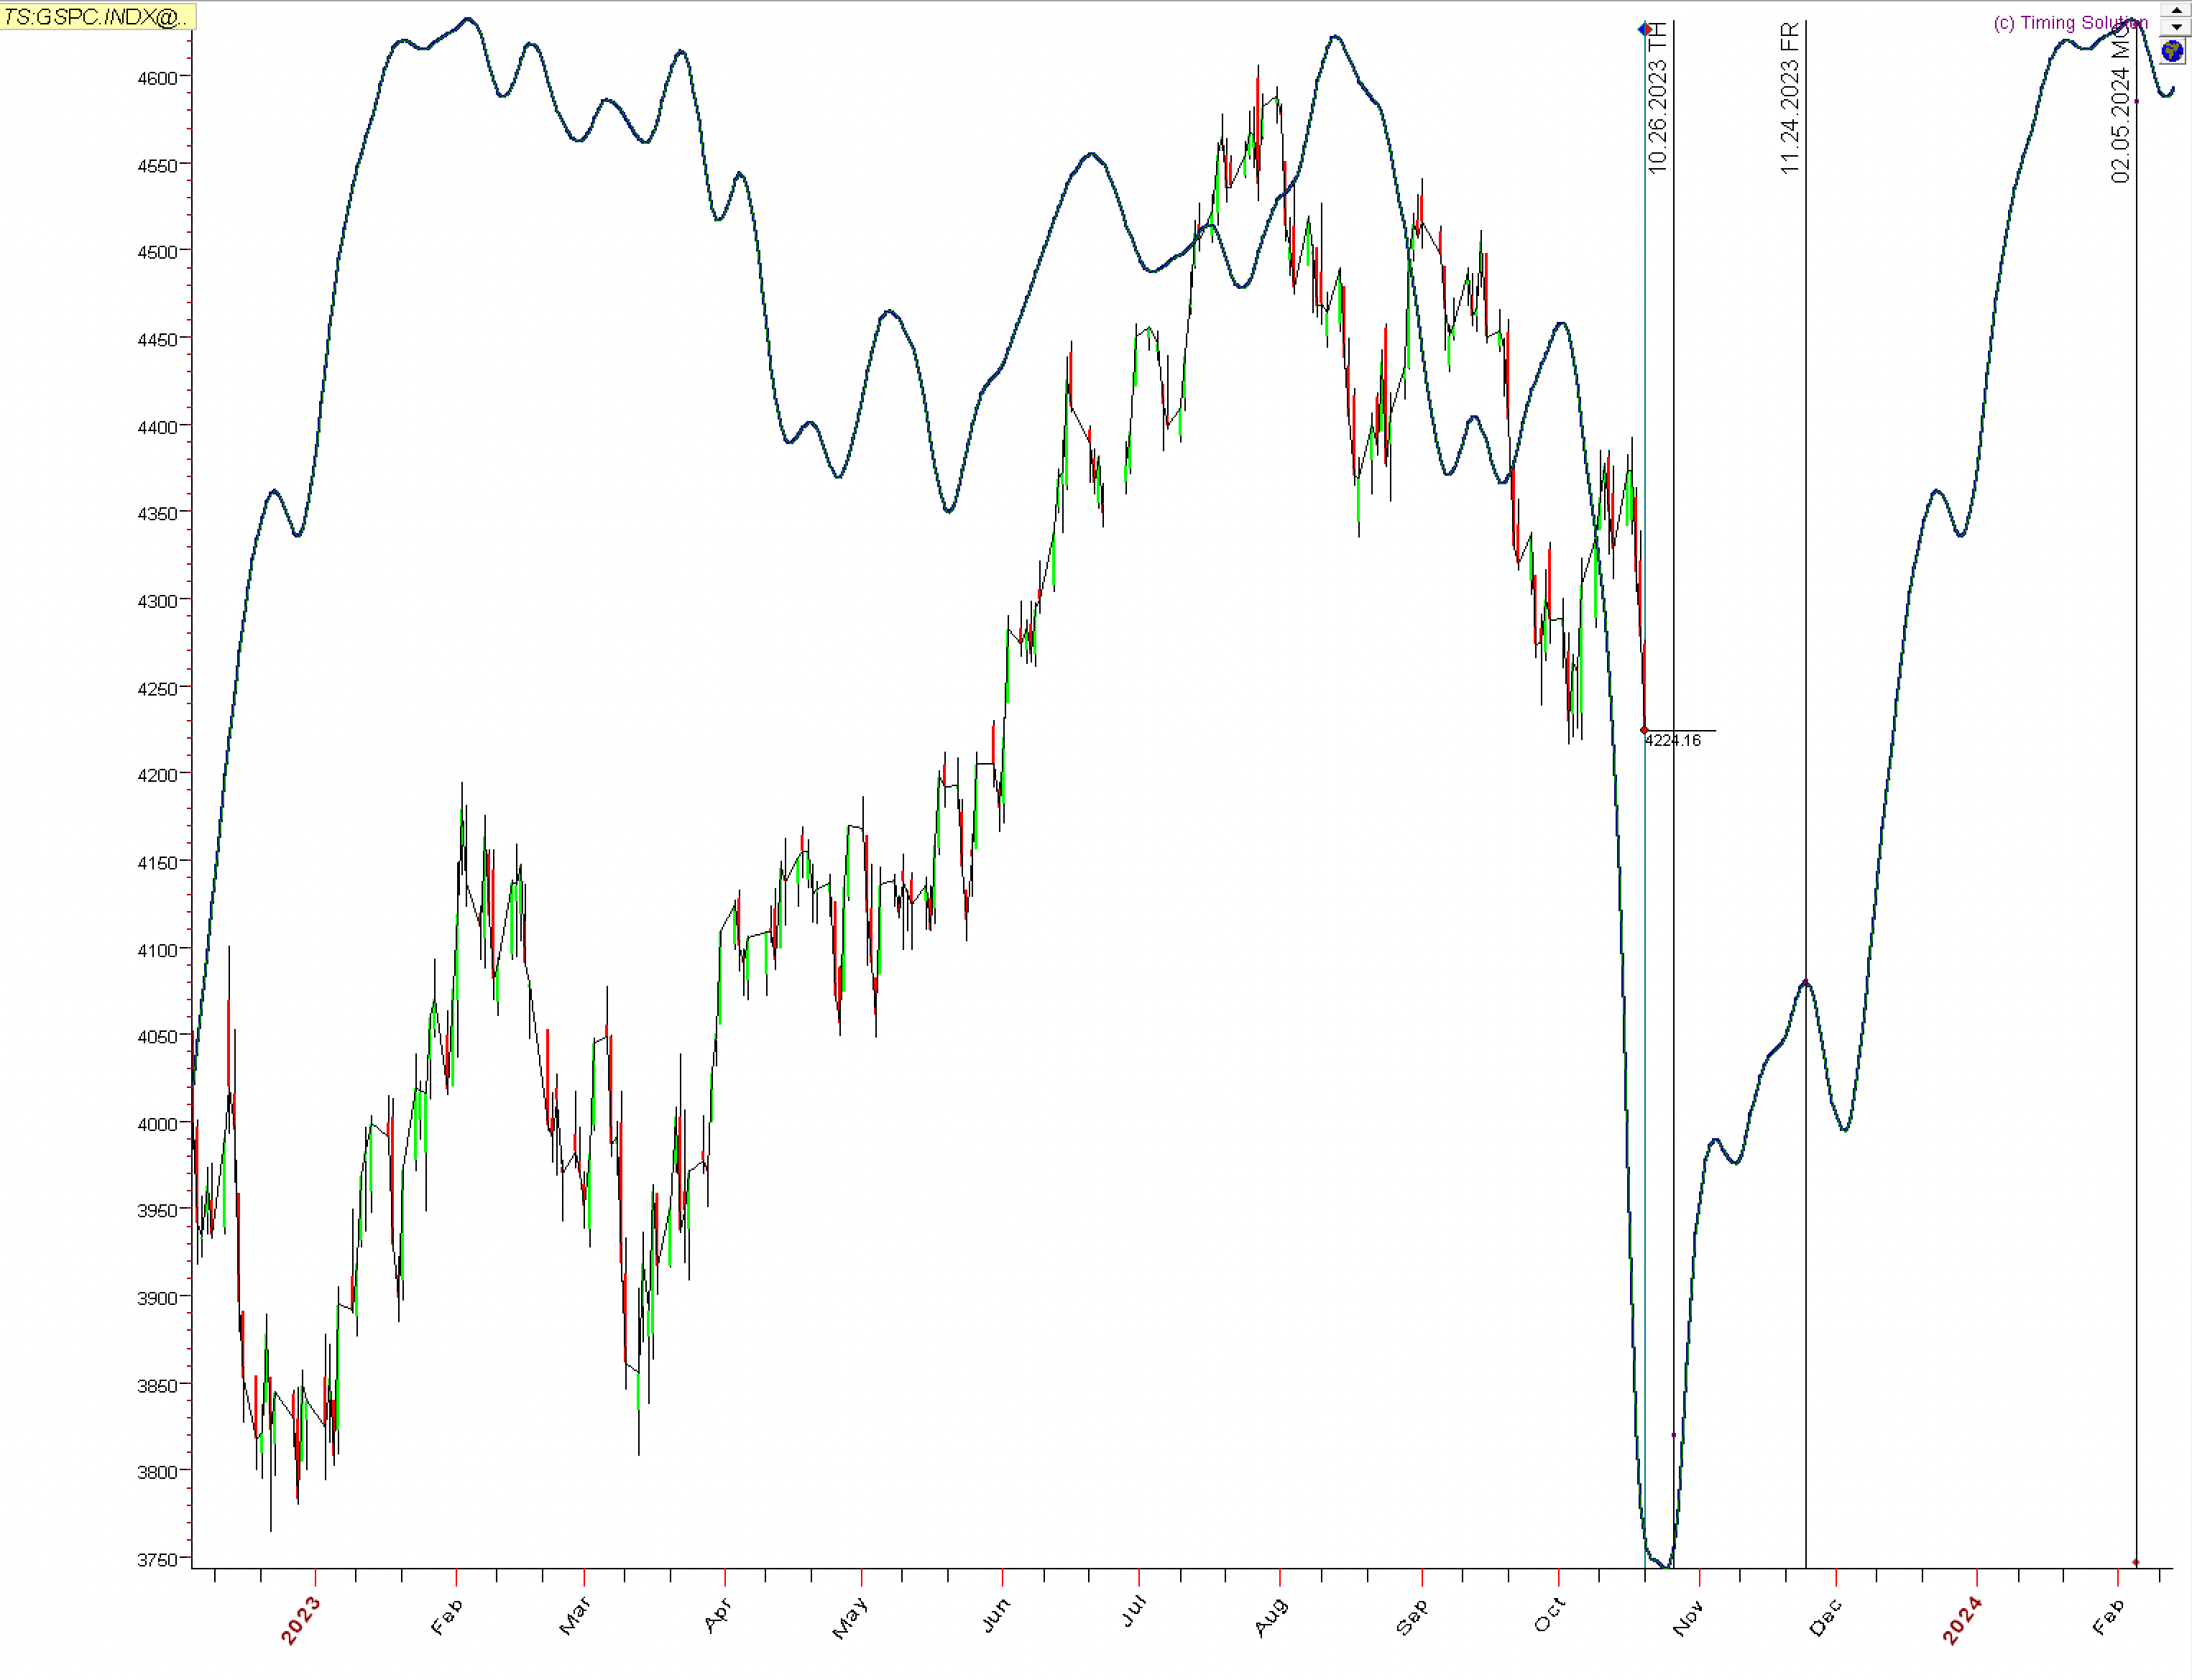
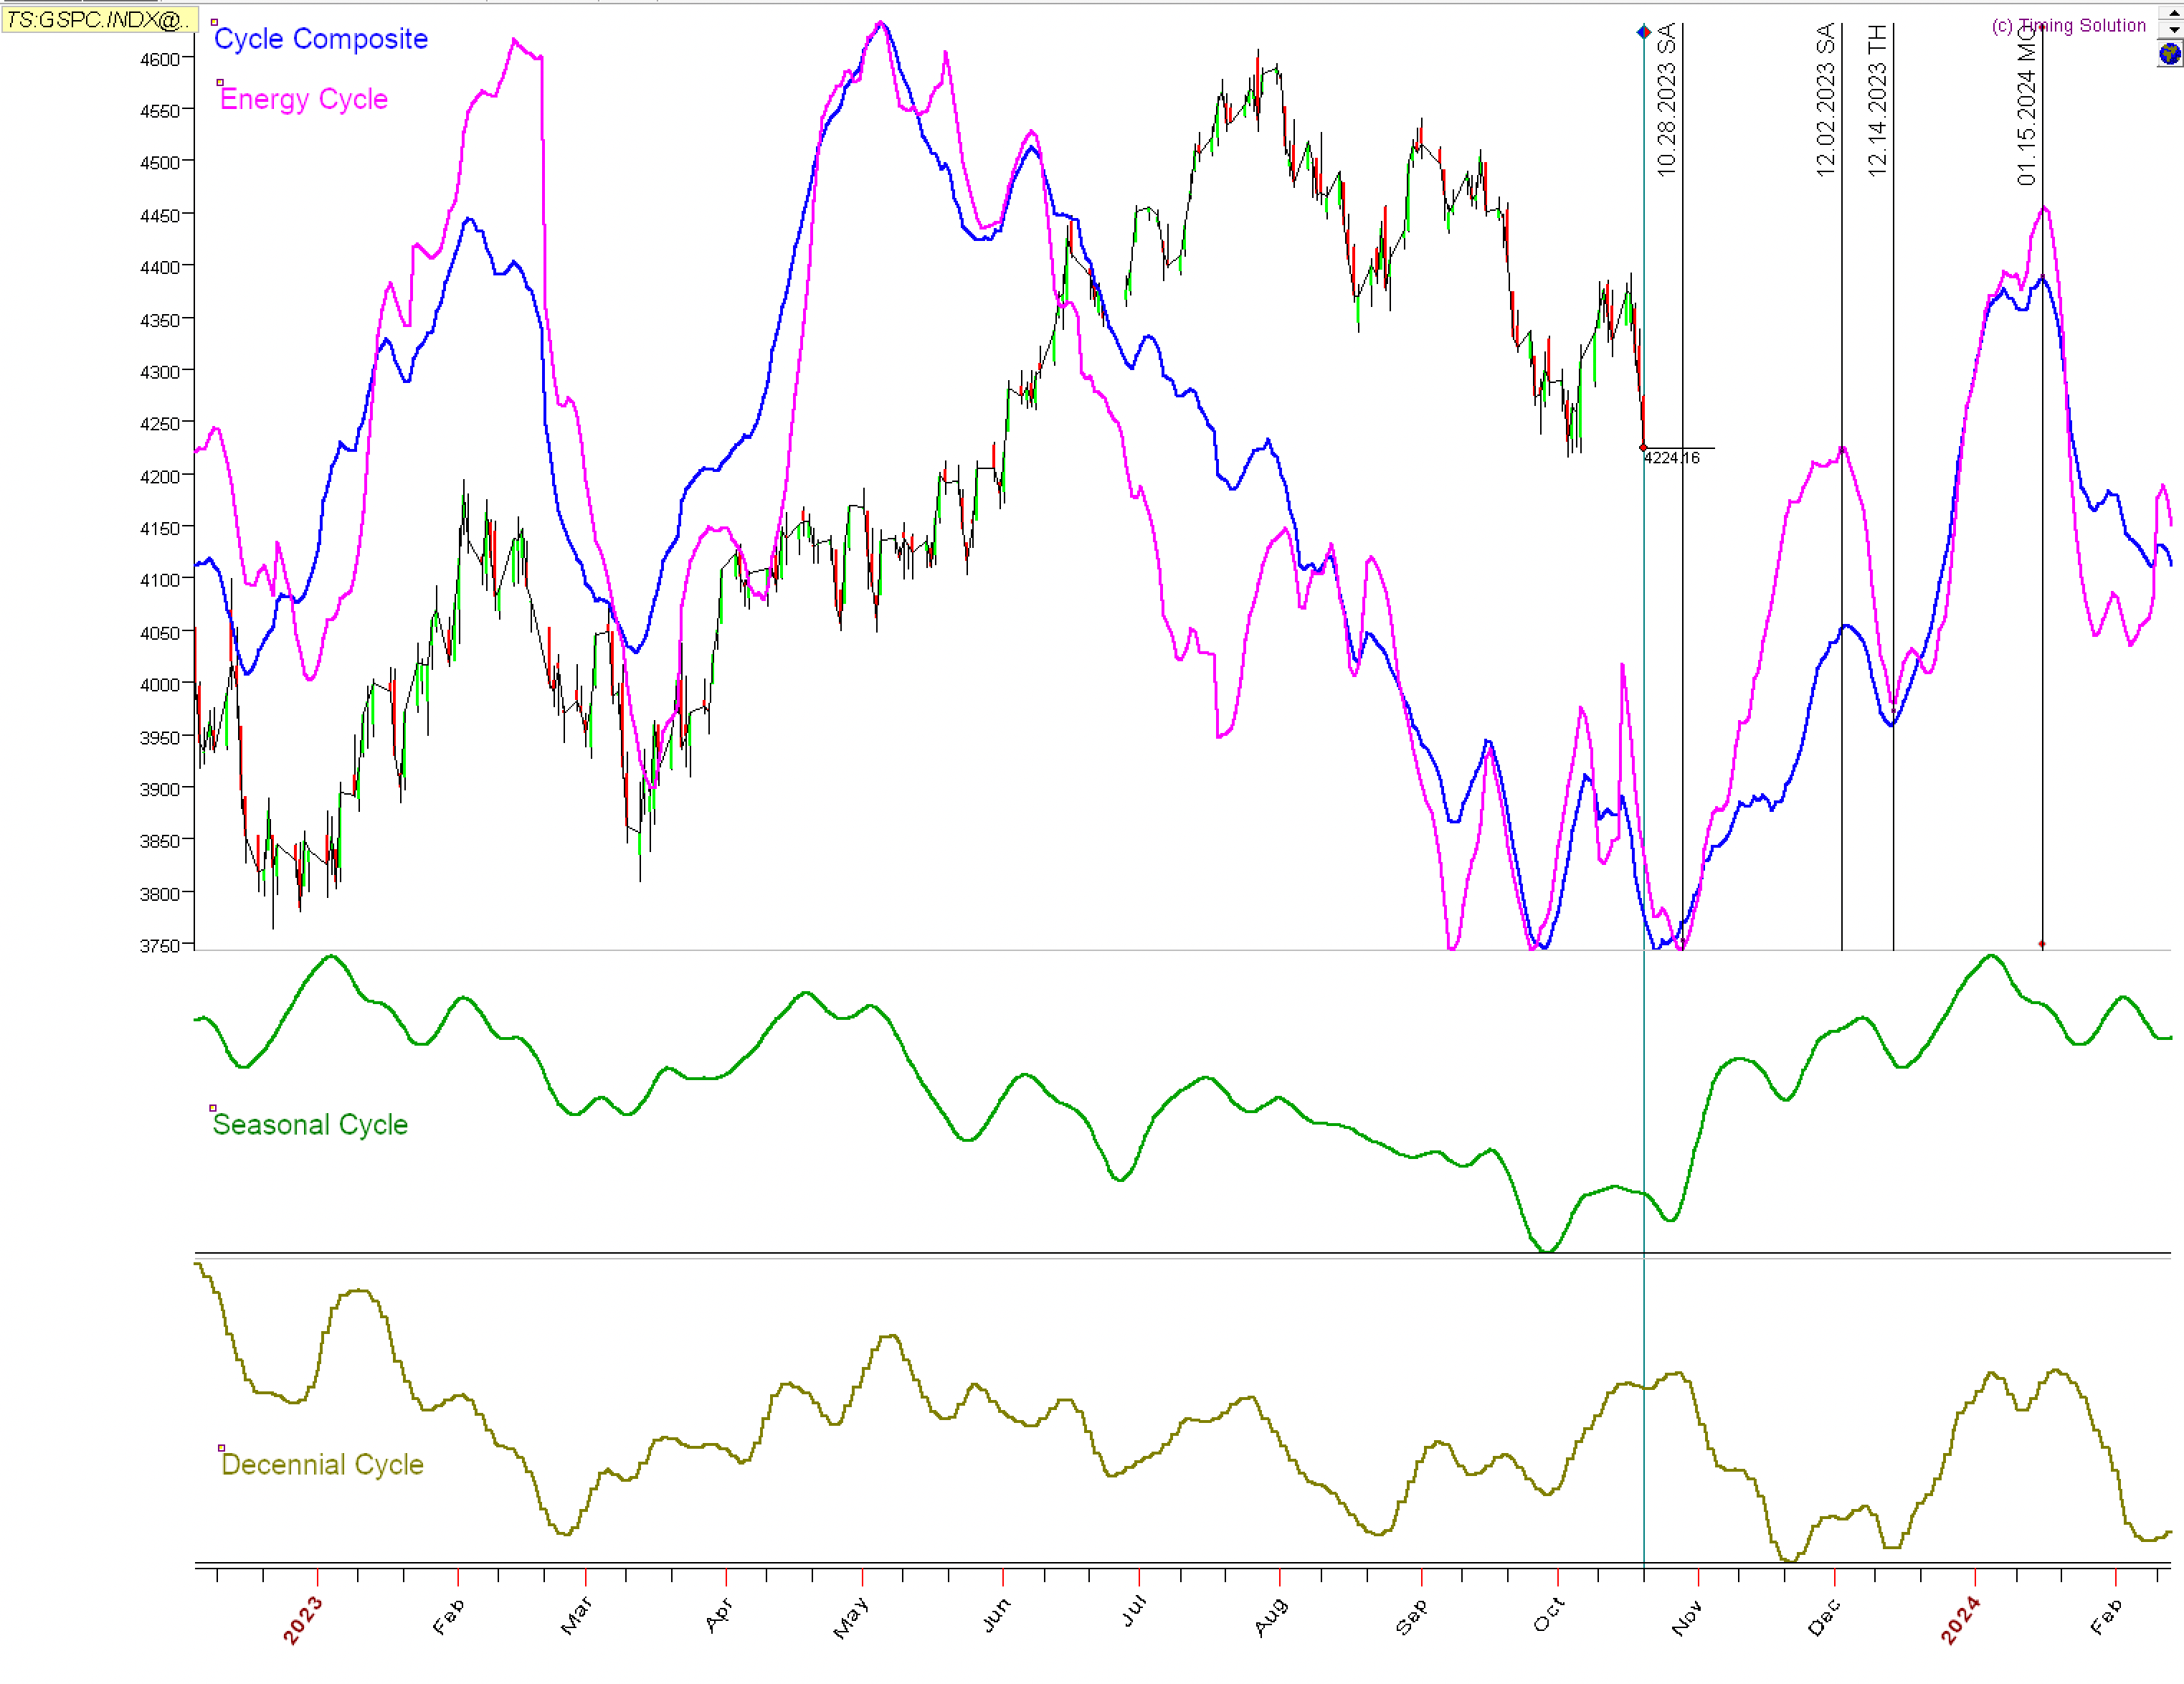
Using the S&P 500 with data starting in 1950, we can see that the Cycles Composite and Energy Cycle forecast a 10/28 bottom. The Seasonal Cycle confirms that an uptrend is likely, however, the Decennial Cycle points to more downside until late November.
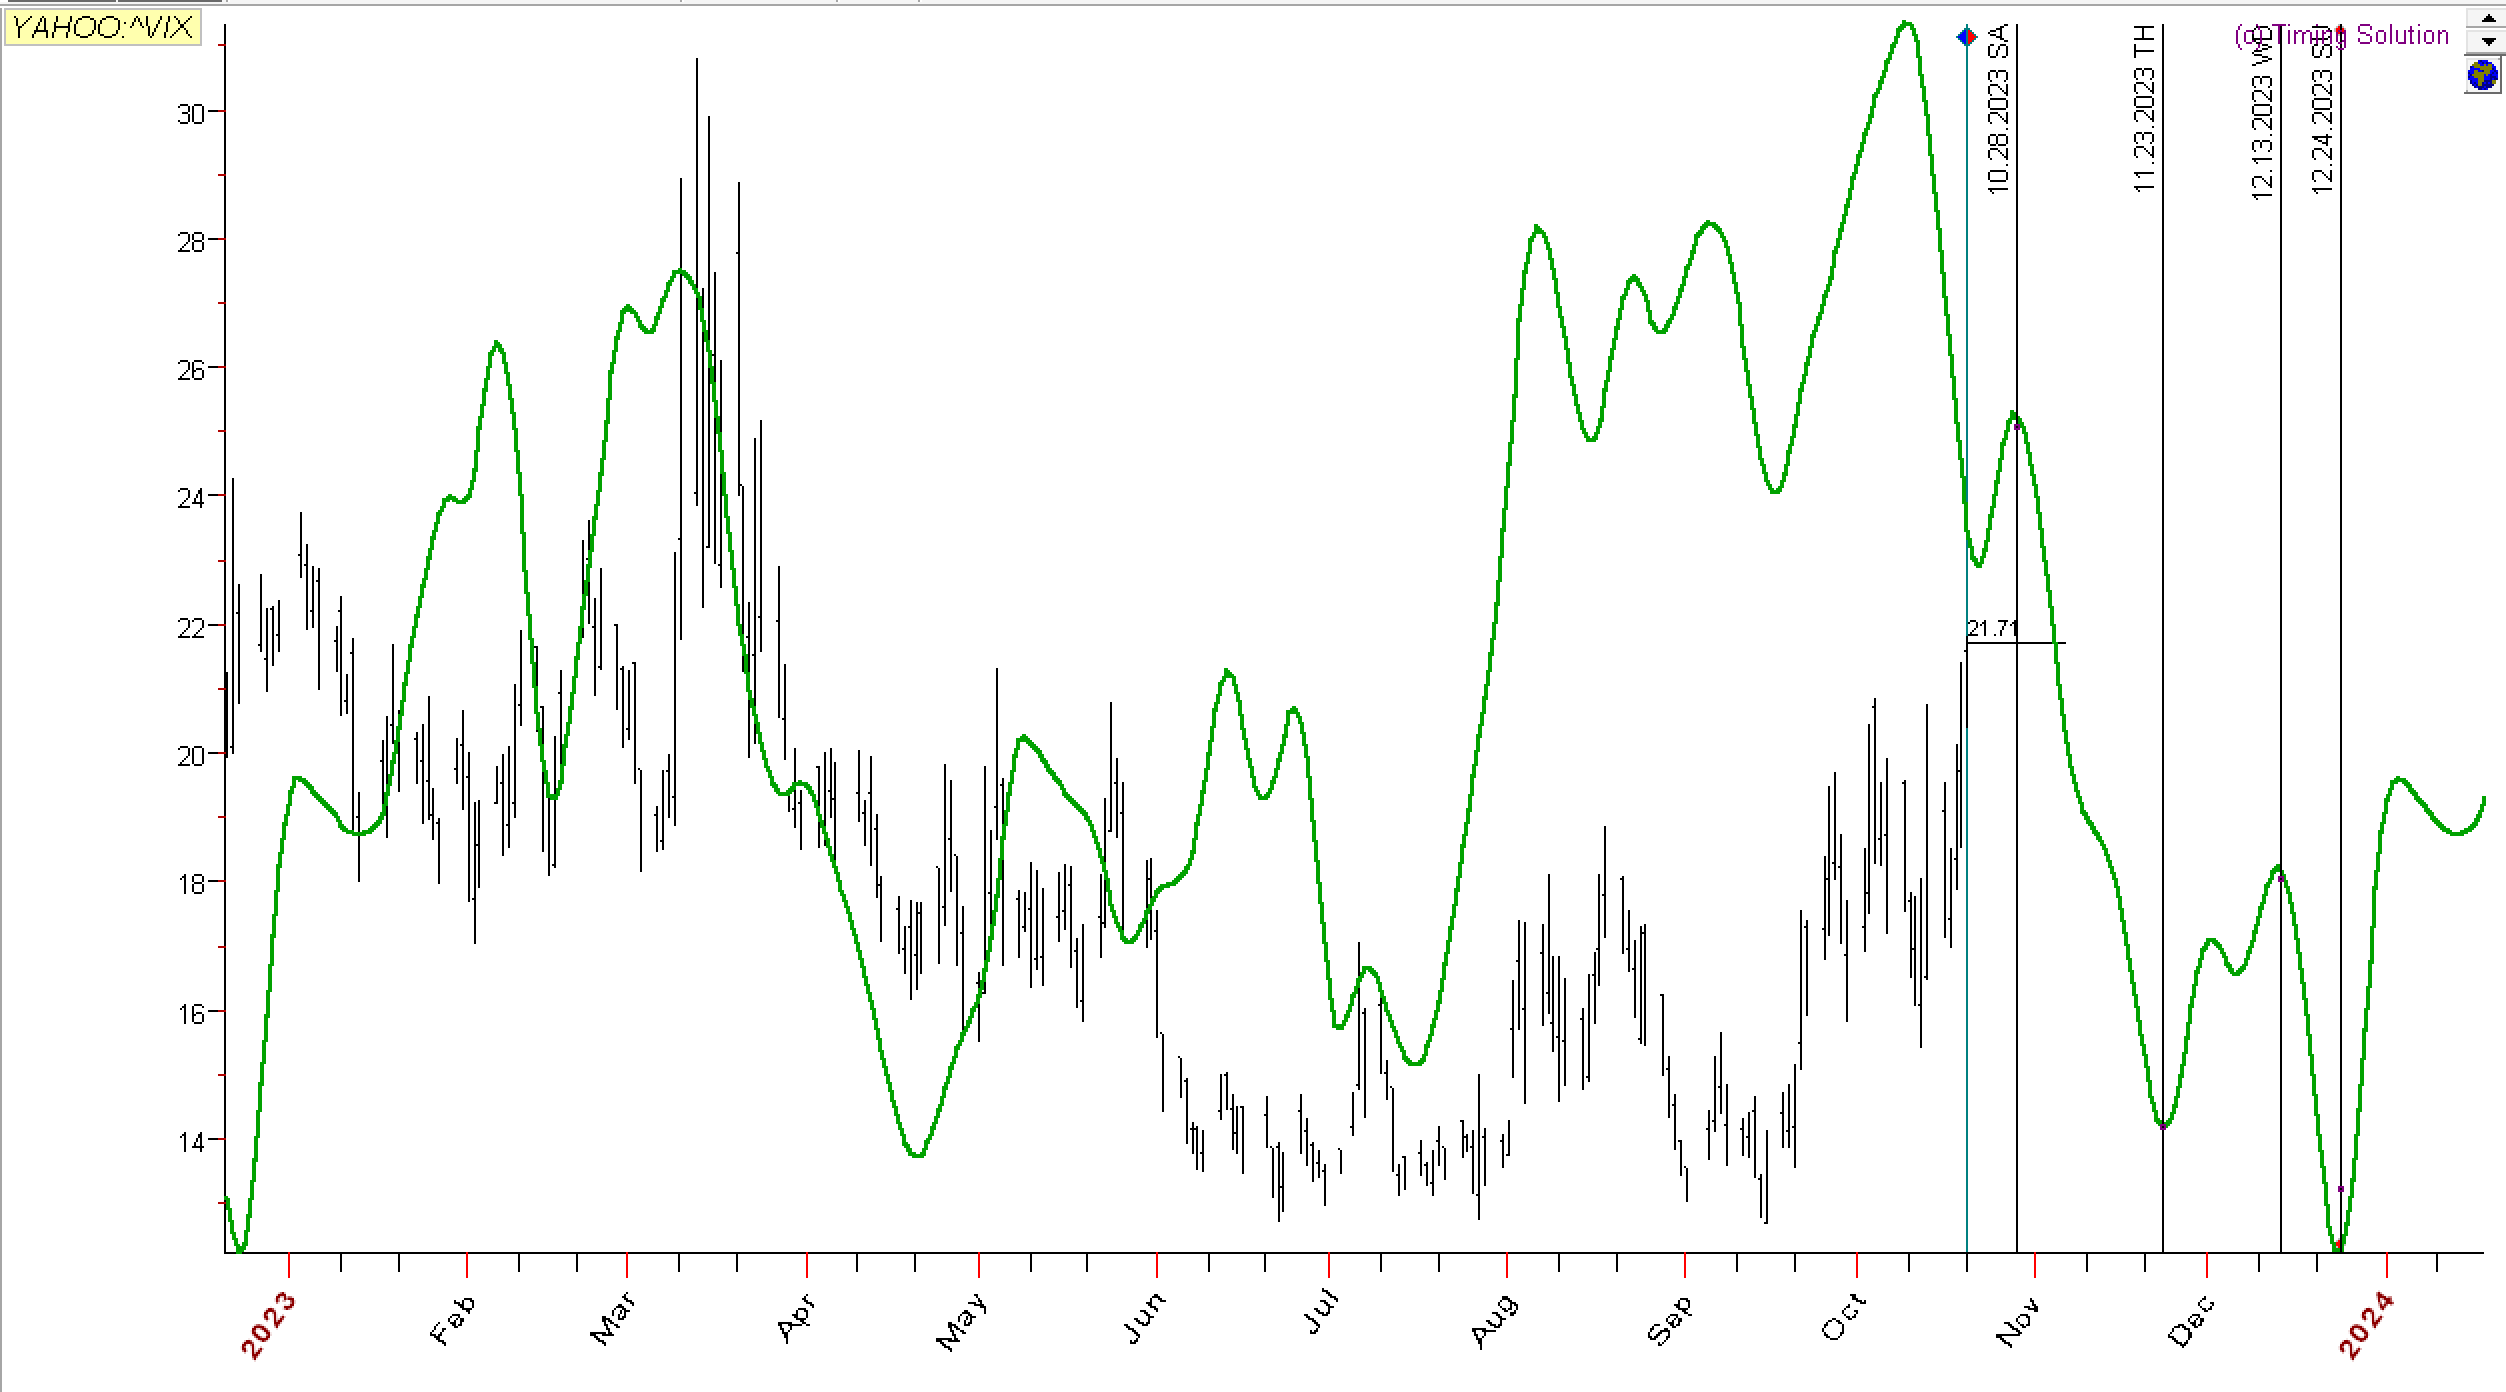
The Seasonal Cycle for the VIX (volatility index) shows that volatility should have started to move down in early October. According to this cycle the VIX should peak around 10/28.
Conclusion:
The market has a lot of negativity right now and is in a downtrend. This is the time to focus on protecting capital and patiently building a watchlist of stocks and ETFs to buy when the market does reverse higher. Anything is possible with the market and a 1987 Black Monday crash is possible, but not probable for 2 primary reasons:
First, the options market for SPY is pricing in a $4.40 (1.04%) move on Monday 10/23 and a $9.45 (2.24%) move through Friday 10/27, which could hurt but is not exactly a crash.
Second, when everyone is expecting or discussing a crash, it usually doesn’t happen.
Disclaimer - All materials, information, and ideas from Cycles Edge are for educational purposes only and should not be considered Financial Advice. This blog may document actions done by the owners/writers of this blog, thus it should be assumed that positions are likely taken. If this is an issue, please discontinue reading. Cycles Edge takes no responsibility for possible losses, as markets can be volatile and unpredictable, leading to constantly changing opinions or forecasts.