

Wyckoff Accumulation - Educational Piece
What To Look For?

Wyckoff Accumulation/Distribution, named after Richard Wyckoff, is a method used in technical analysis to identify potential Accumulation or Distribution phases in the price of an asset/stock. Typically, the moves that comes out Wyckoff Accumulation or Distribution are very big in size, so being on the right side is often extremely profitable.
During accumulation, smart money quietly buys the asset at lower prices, leading to a sideways or slightly downward price movement.
Conversely, during distribution, smart money sells their holdings to the public at higher prices, leading to a sideways or slightly upward price movement.
Traders use Wyckoff analysis to detect these phases and make trading decisions based on them. The best part is that Wyckoff Accumulation/Distribution is a common pattern seen across different asset classes, so learning this can very useful irrespective of the stock/asset that one trades/invests in.
There are 2 types of Accumulation patterns and 2 types of Distribution patterns. This Educational Piece covers the 2 types of Wyckoff Accumulation patterns. A follow up Educational Piece will cover the 2 types of Wyckoff Distribution patterns.
Wyckoff Accumulation Pattern 1

PS - Preliminary Support, where substantial buying begins to provide basic support after a prolonged down-move. Volume increases and price spread widens, signaling that the downtrend may be nearing its end.
SC - Selling Climax, the point at which widening spread and selling pressure usually climaxes and heavy or panicky selling (capitulation) by the public is being absorbed by larger professional players at or near a bottom. Often price will close well off the low in a Selling Climax (large wicks are present), reflecting strong buying interest in this region.
AR - Automatic Rally, which occurs because intense selling pressure has greatly diminished. A wave of buying easily pushes prices up. This is further fueled by short covering. The high of this rally will help define the upper boundary of an accumulation Trading Range.
ST - Secondary Test, in which price revisits the area of the Selling Climax to test the supply/demand balance at these levels. At times, the price can drop slightly below the Selling Climax region. If a bottom is to be confirmed, volume and price spread should be significantly reduced as the market approaches support around the Selling Climax. It is common to have multiple Secondary Tests after a Selling Climax. Bounces after Secondary Tests often reach near the top of the Trading Range.
Spring - Usually occurs late within a Trading Range and allows the smart money to make a definitive test of available supply before a markup (move up) campaign begins. A “spring” takes price below the low of the Trading Range (below the Selling Climax and Secondary Test) and then reverses to close within the Trading Range. This action allows large players to mislead retail investors about the future trend direction and to acquire additional shares at bargain prices. “Spring” is often a very volatile flush down, which catches most people off-guard, especially the leveraged longs.
Test - Large players always test the market for supply throughout a Trading Range and at key points during a price advance. This helps determine support regions and give a sense of the supply/demand balance in a particular region.
LPS - Last Point of Support, the final stage of accumulation within the market for a particular asset. It represents the point where buying pressure overwhelms selling pressure, leading to a significant support for price. This phase typically occurs after prolonged accumulation, where smart money accumulates heavy positions while retail investors remain hesitant. This support marks the end of the accumulation phase and often precedes a substantial increase in the security's price.
SOS - Sign Of Strength, a price advance on increasing spread and relatively higher volume. Often a Sign of Strength takes place after a “Spring” since most of the weak hands sell during the “Spring” phase, so the path of max pain becomes to the upside.
BU - Back-Up, a temporary retracement or pullback in price after the completion of Sign of Strength. It typically occurs after the price has experienced a significant upward movement, marking the end of the accumulation phase and the beginning of a new uptrend. During the Back Up, prices retest previous Trading Range resistance to confirm it as support, providing an opportunity for traders to enter long positions before the next major move higher.
Example
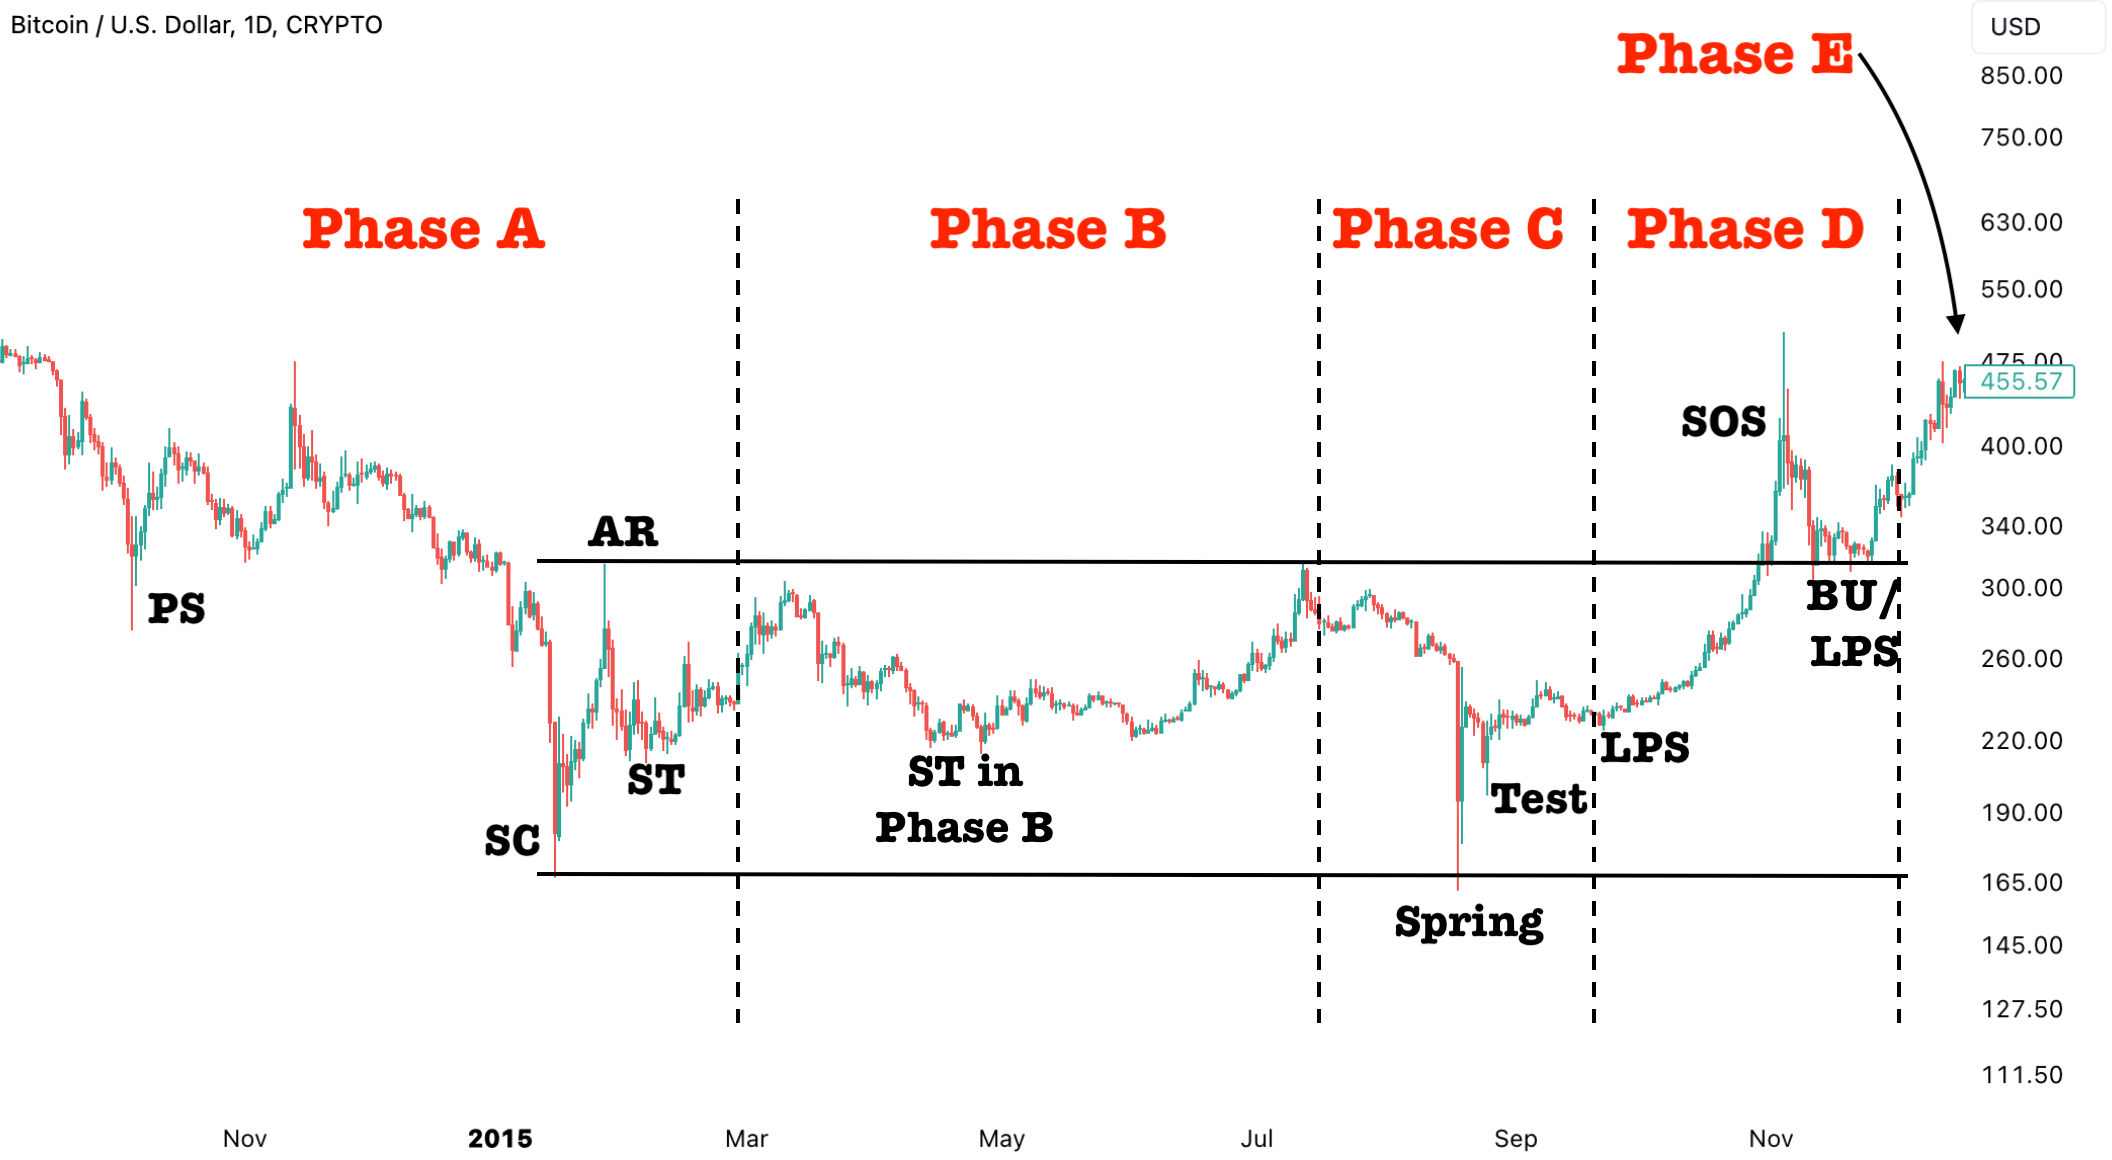
A Wyckoff Accumulation pattern 1 was seen during the Bitcoin’s 2015 bottoming process. Notice how in Phase C, the “Spring” takes out the Trading Range low, but goes onto close within the Trading Range. This helps smart money catch retail off-guard and trigger the stop-losses for leverage positions that have their stops right underneath the lows of the Trading Range.
In the next section, we’ll cover Wyckoff Accumulation pattern 2 with examples.
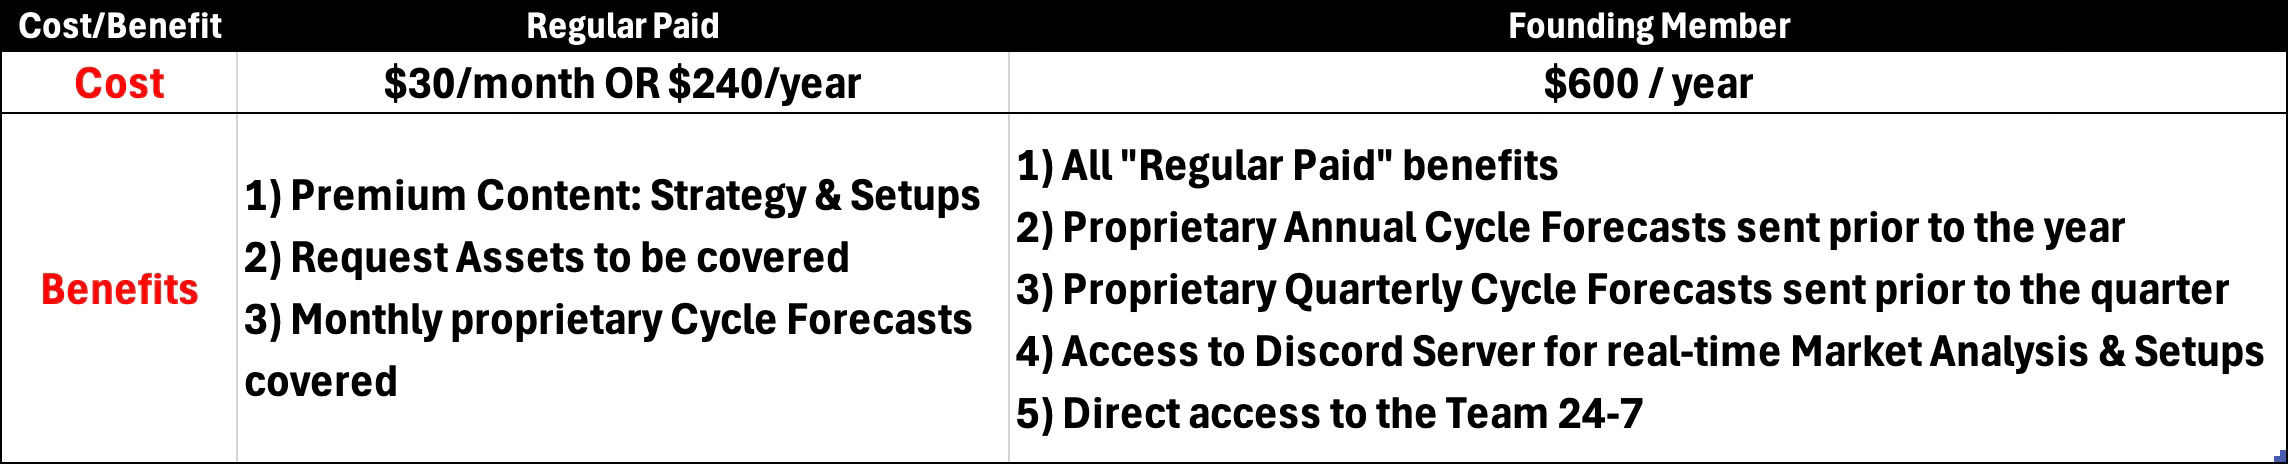
Find our membership cost/benefits below. If you’re serious about Making Money (our primary goal at Cycles Edge), then the Premium Sections are key for you!