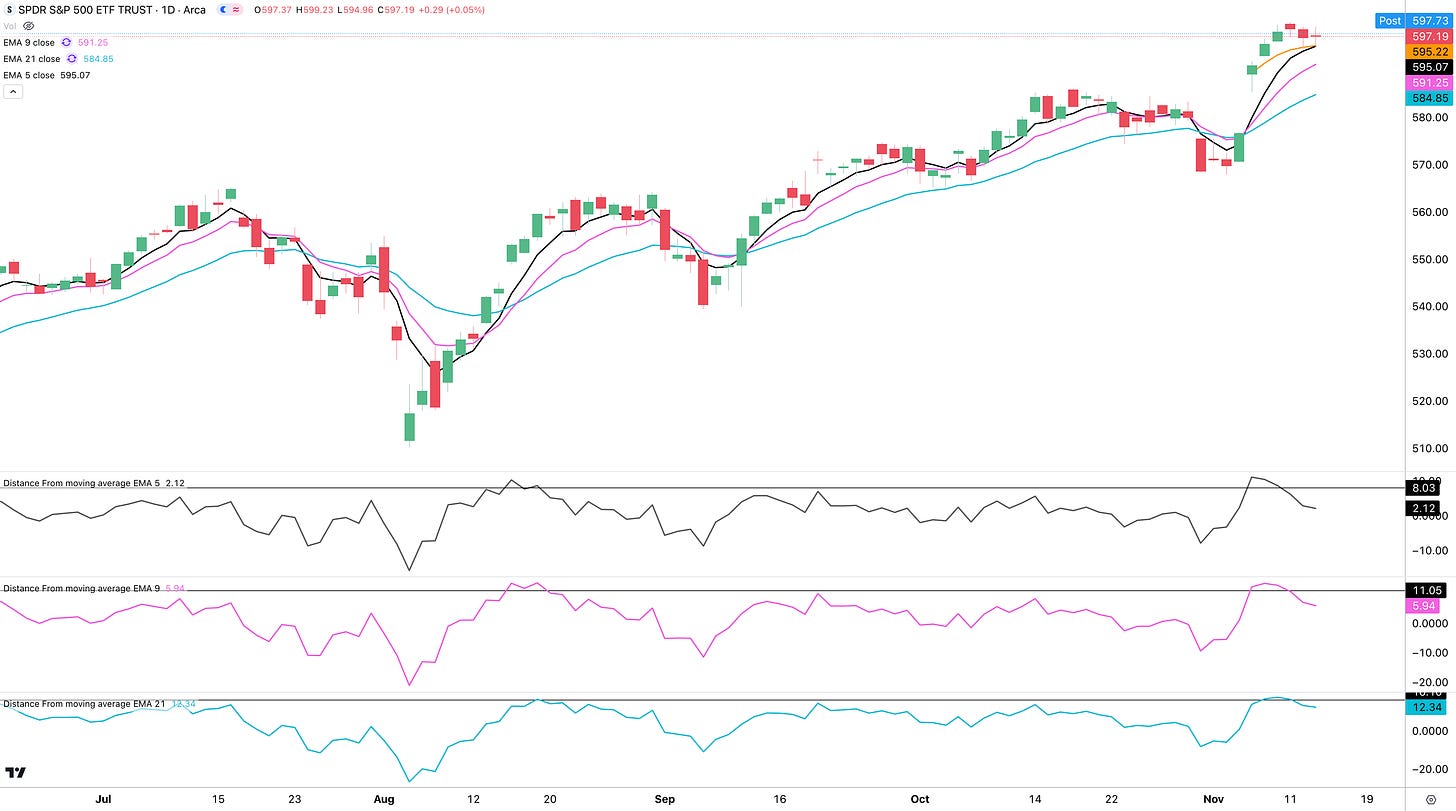
Last Sunday we mentioned that the S&P 500 (SPY) was a bit overbought and could pullback to retest the 5 or 9 EMAs. This week it pulled back to the 5 EMA (black) and is currently holding support there with the added support of the Post Election Day Anchored Weighted Average Price (“AVWAP” in orange). Notice that the Distance from the 5, 9 and 21 EMAs are still heading down, so chances are that more downside is in store. When all three indicators start pointing upward simultaneously, the pullback is likely over, which is not the case at this time.
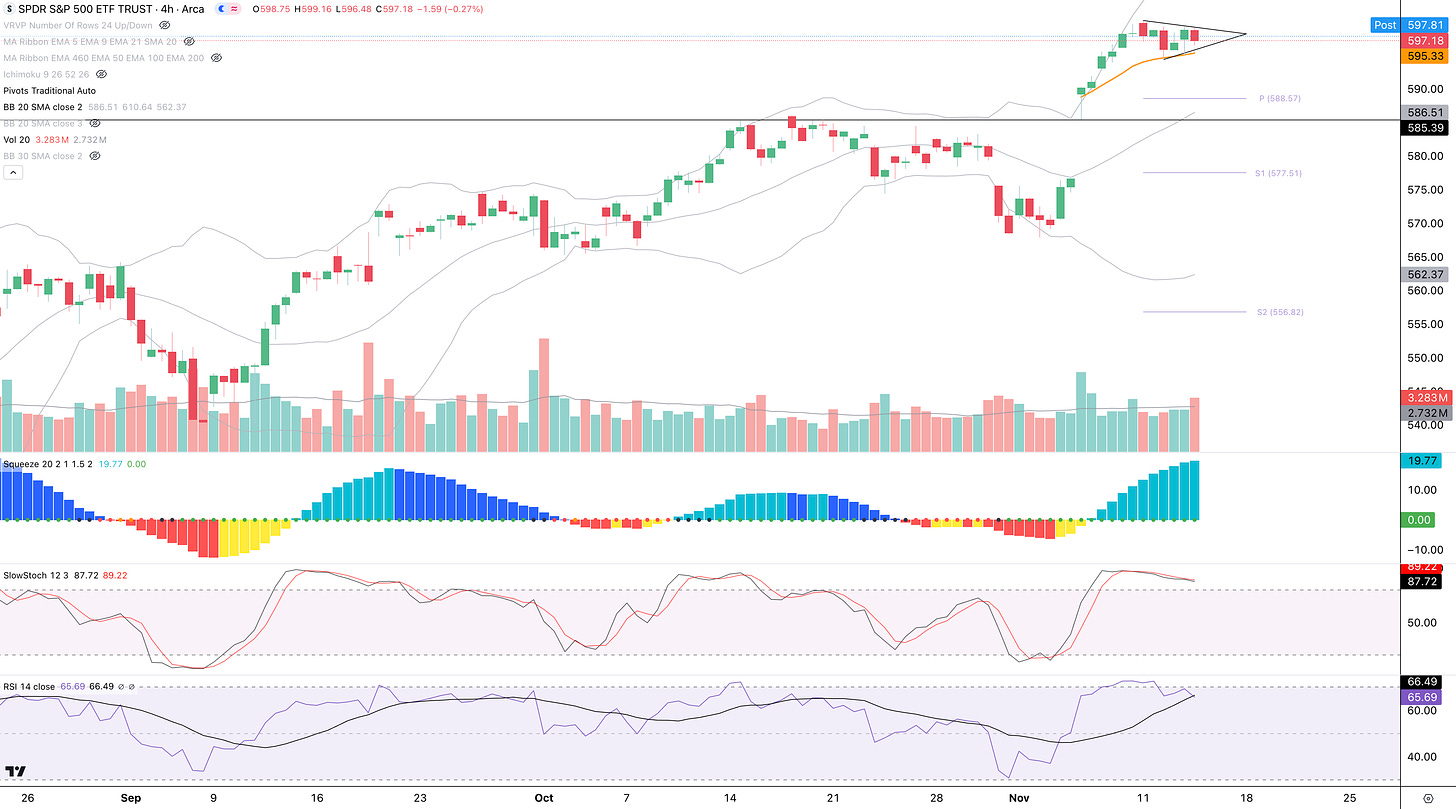
In the 4-hour chart below, we can see that SPY is forming a flag pattern, and we are watching for a breakout to determine if it will move to the next level up or down. With the Slow Stochastics indicator in the overbought range and the RSI showing a bearish divergence in the overbought zone, it would be healthy for SPY to head lower and possibly retest the $585 area, which aligns with the post-election day low and prior high support.
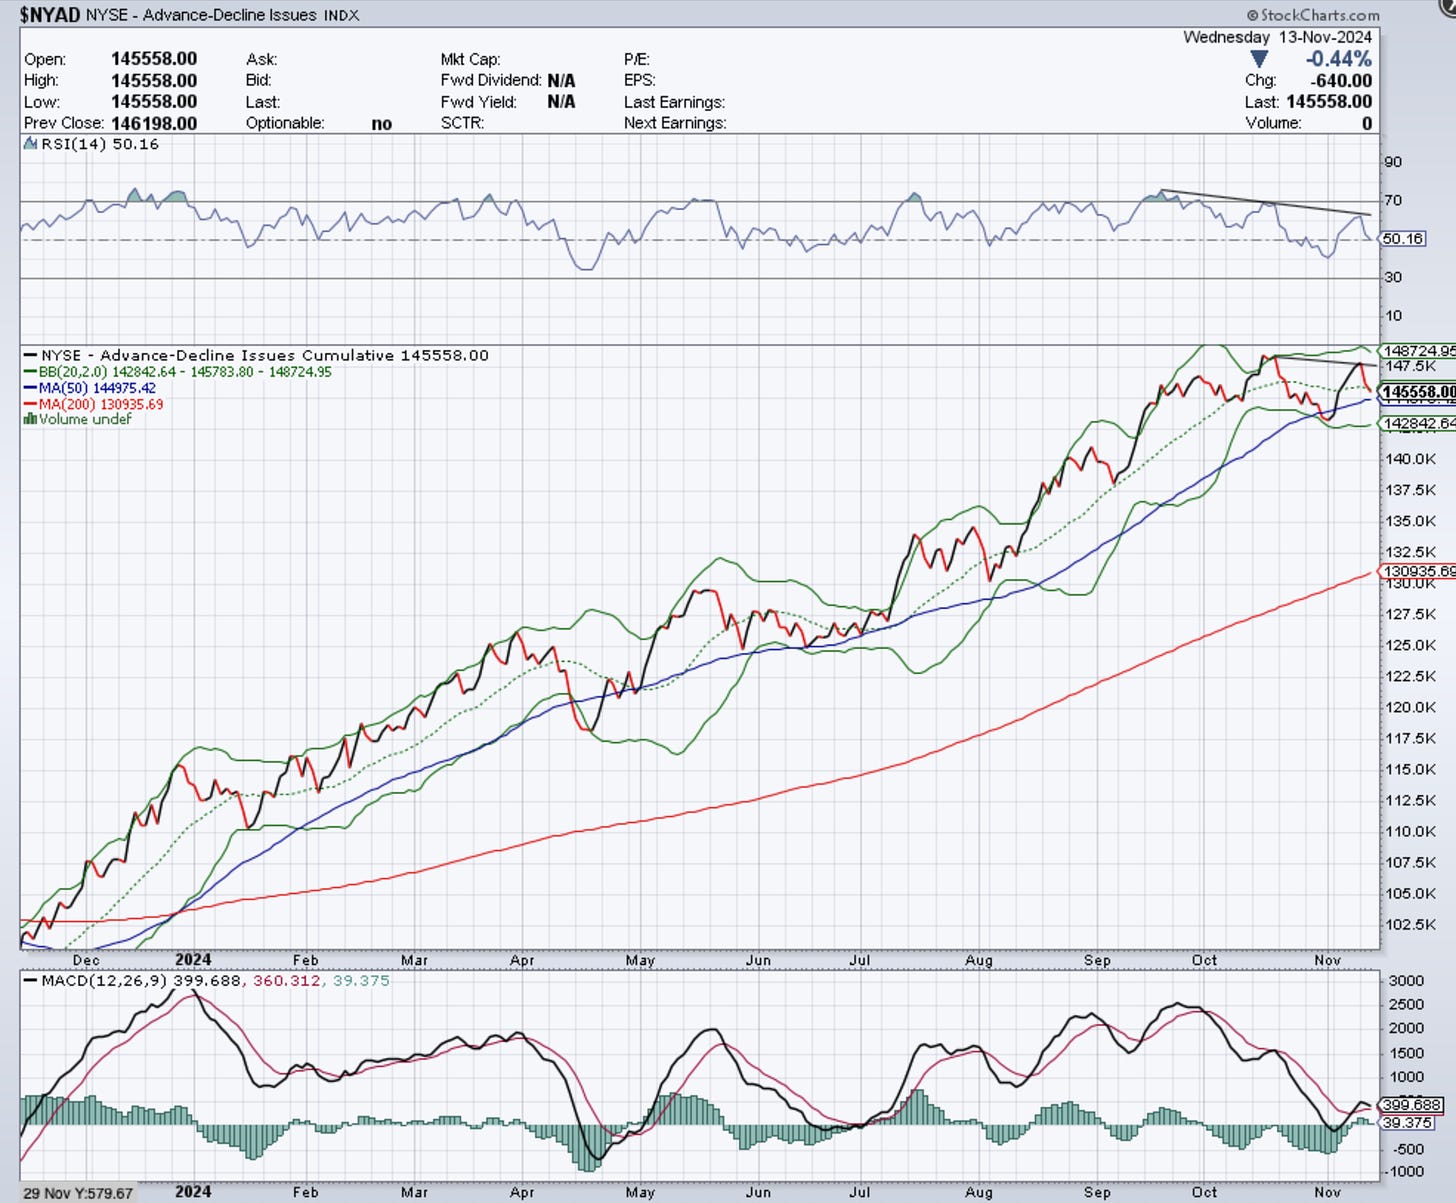
Despite the strong post-election rally, the NYSE Advance/Decline Line ($NYAD) is showing technical weakness. Both the $NYAD and its RSI indicator are making lower highs and displaying bearish divergences. When market breadth doesn’t support a rally, subsequent weakness can catch people off guard.
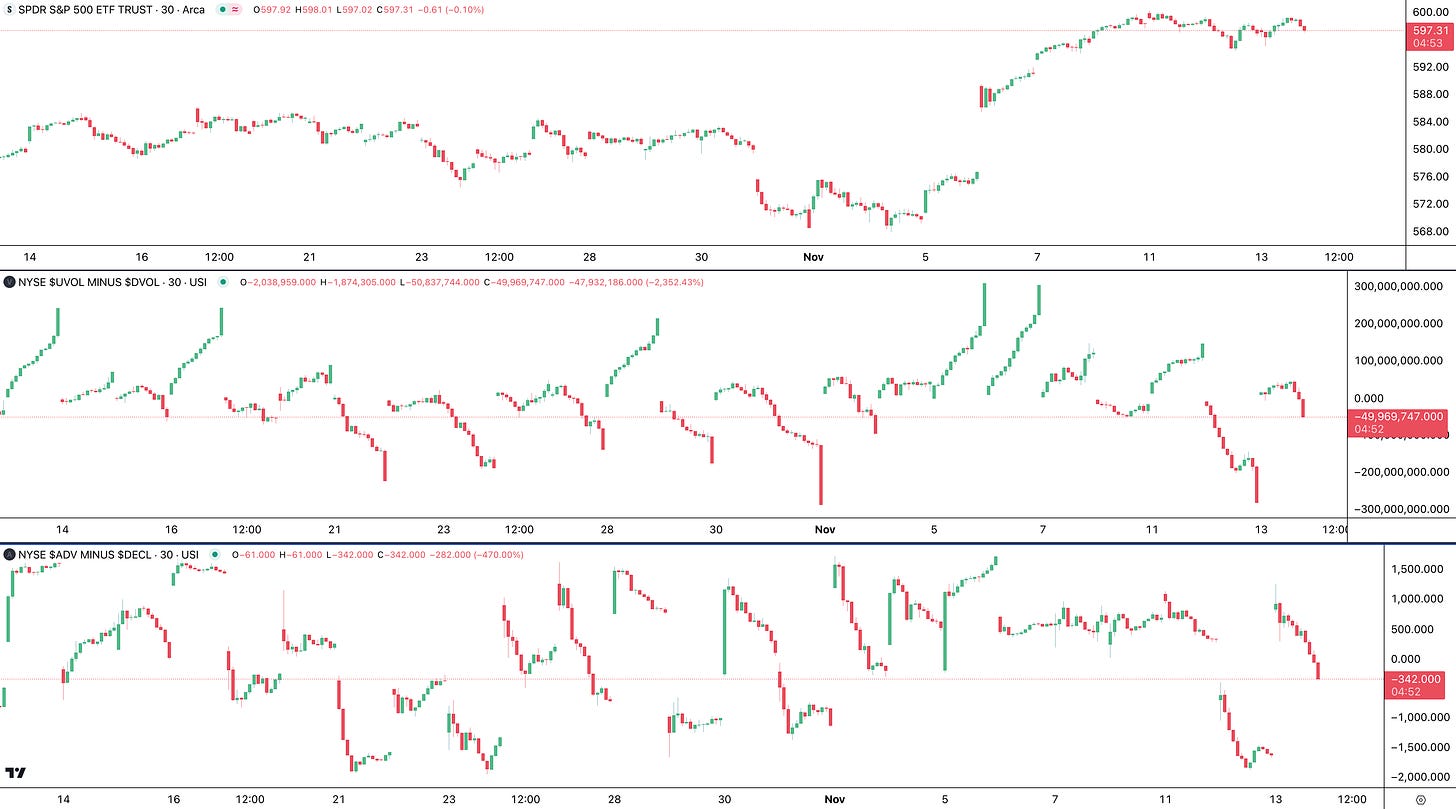
The chart below shows the SPY (upper), the Advance/Decline Volume (VOLD, middle) and the Advance/Decline Issues (ADD, lower). Notice that as SPY trudges sideways, the VOLD and the ADD are showing institutional selling.
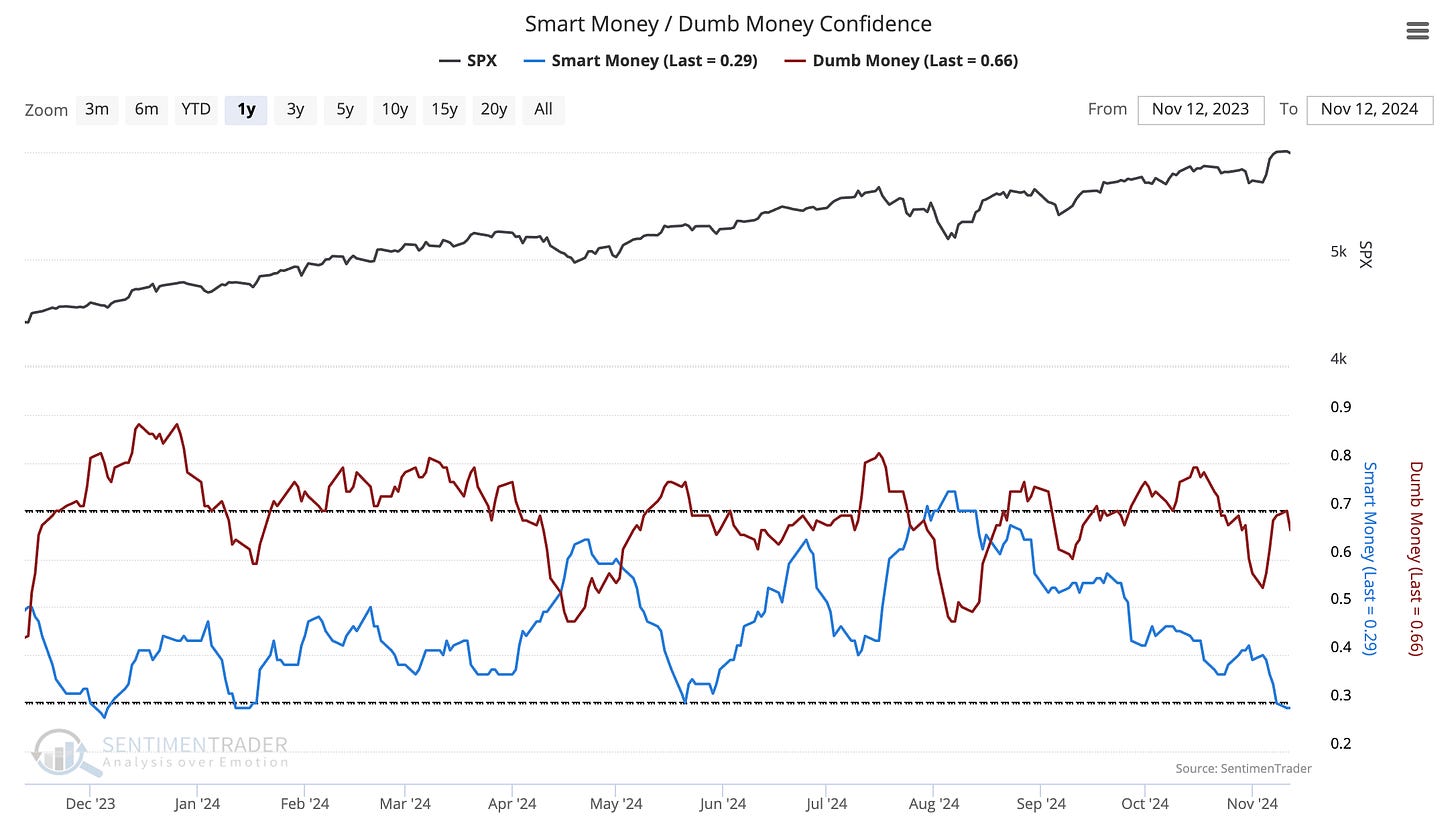
This may reflect Smart Money selling at high levels, with Dumb Money now starting to follow suit. When both Smart and Dumb Money are selling, who is left to keep prices moving higher? The good news is that with Smart Money exposure so low, we can expect them to redeploy capital and begin buying at lower levels. This would create an excellent buy-the-dip opportunity.
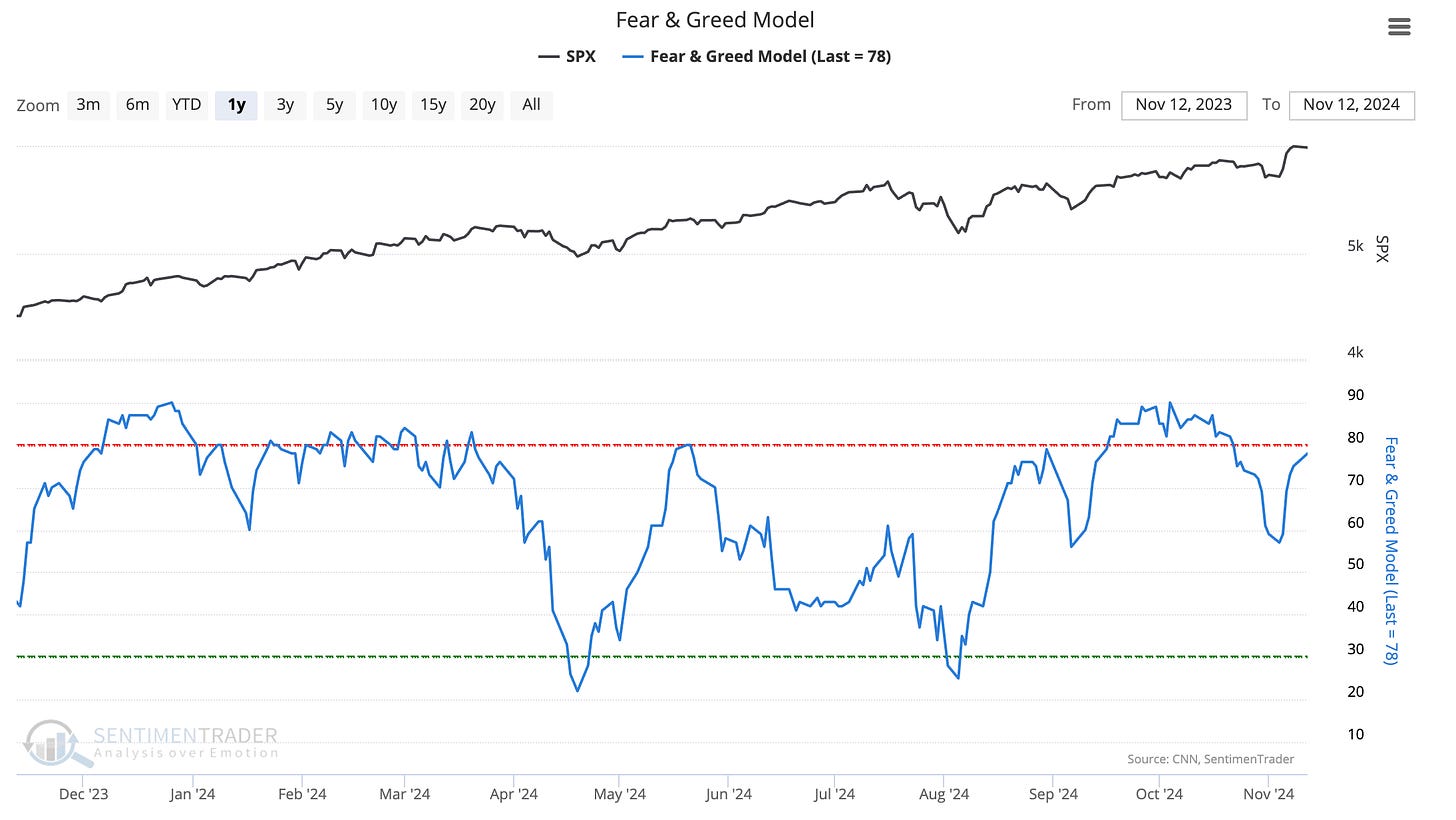
Greed keeps heading higher and this may be allowing Smart Money to exit at high levels. If the market breaks below support levels, it may reintroduce fear.
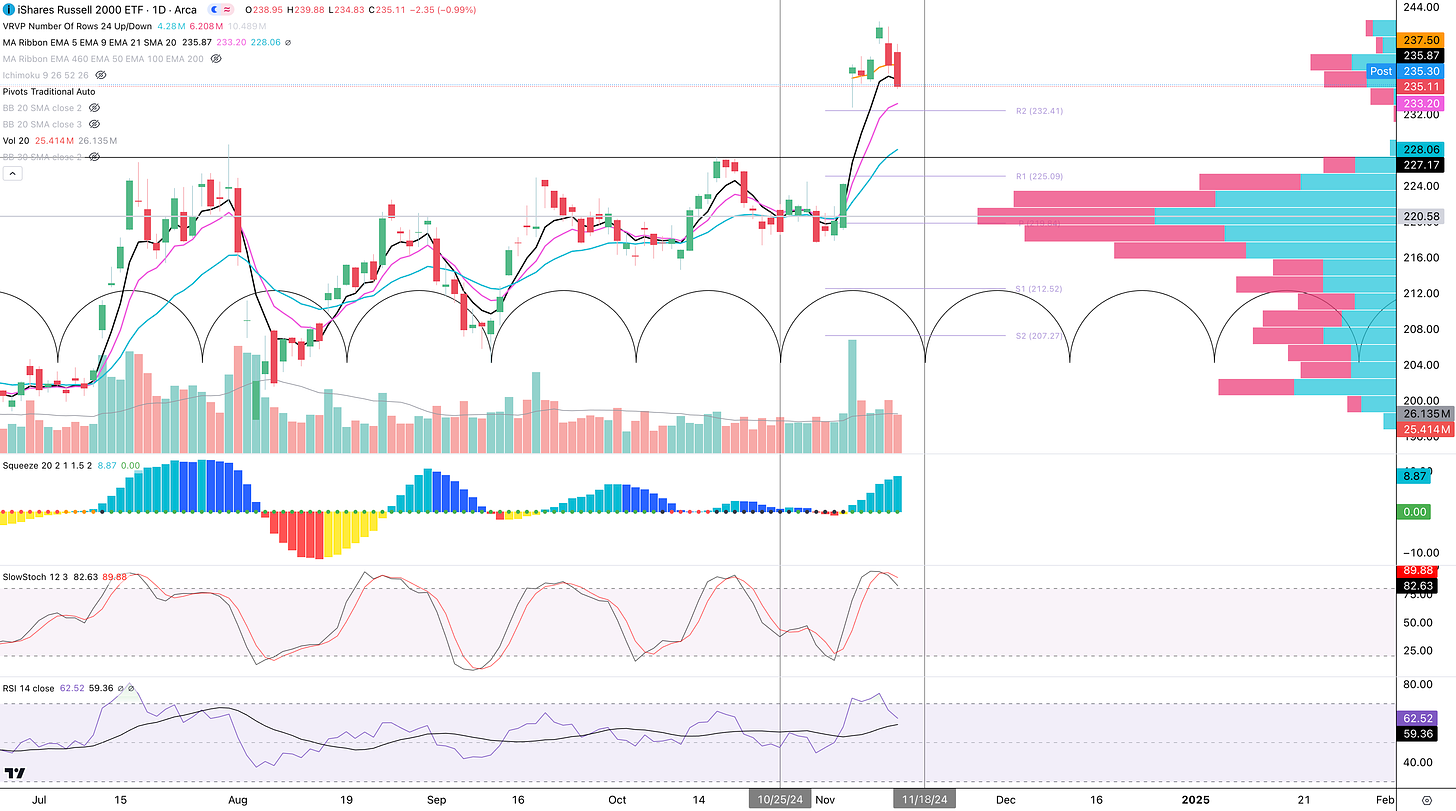
The Russell 2000 Small Cap Index (IWM) may be leading the way down. Notice that IWM broke below the 5 EMA (black) and the Election Day AVWAP (orange). The next stop is the $232 to $233 confluence zone from the 9 EMA, R2 Pivot Point and the Post Election Day low.
In the Premium Section we’ll reveal our Cycle Forecast for the Russell 2000, which may be the best forecast to use to buy “Bagger” or small to mid cap growth stocks.
Disclaimer - All materials, information, and ideas from Cycles Edge are for educational purposes only and should not be considered Financial Advice. This blog may document actions done by the owners/writers of this blog, thus it should be assumed that positions are likely taken. If this is an issue, please discontinue reading. Cycles Edge takes no responsibility for possible losses, as markets can be volatile and unpredictable, leading to constantly changing opinions or forecasts.


