This week, we’ll review market conditions, and in the Premium Section, we’ll examine ETFs and stocks demonstrating relative strength under the new U.S. presidency.
Market Conditions
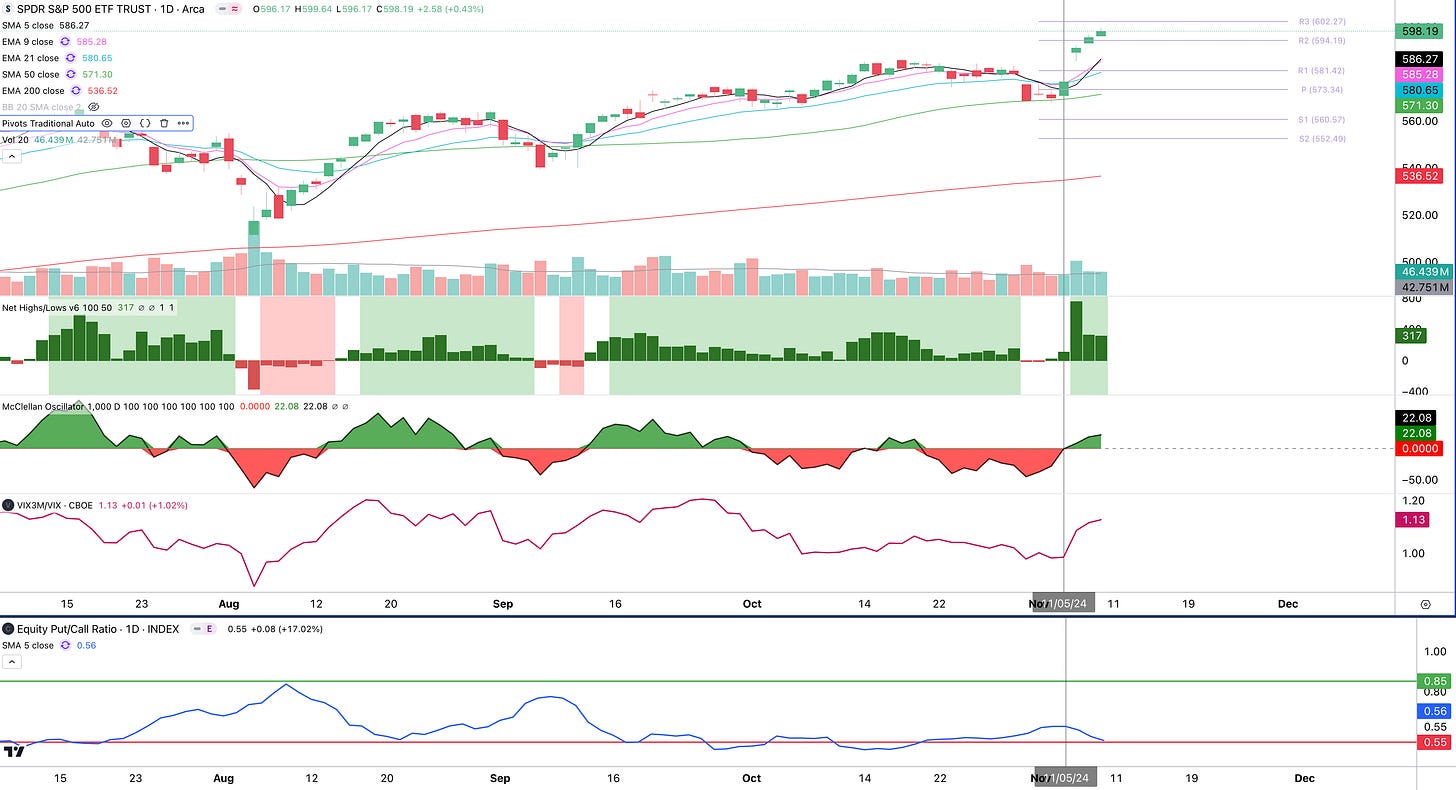
The S&P 500 (SPY) was up 4.75% for the week, driven by the election of Donald Trump as the 47th US President. The SPY is now trading above all moving averages once again and is in a new uptrend. The strength of this uptrend allowed the SPY to move past the R1 and R2 Pivot Points with ease. Looking at the chart below we can see that everything changed after 11/5, after the election. From 11/6 we can see that the the SPY gapped up as:
Net New Highs popped, telling us that this is a good environment for individual stocks
The McClellan Breadth Oscillator ascended above the 0 mark, which is bullish
The VIX Curve (VXV/VIX) increased above 0 and is now at 1.13. Note that the market tends to slow down and find resistance when this indicator hits the 1.20 mark. More upside is possible, perhaps to the R3 Pivot Point at $602.
The 5 Simple Moving Average (SMA) of the Equity Put/Call Ratio began to fall once again, telling us that the market bought many call options. It seems like the market will not wash out call options yet and with this, more upside is possible.
In summary, the SPY is in a healthy uptrend once again and possible pullbacks to the 5 or 9 EMAs (pullback to the 21 EMA is less likely) would be excellent buy-the-dip opportunities.
For now the Lockout Rally is still intact, as we first mentioned here. On the 30-minute chart below, SPY is trending above the 9 EMA (pink). It may dip to the 21 EMA at $596.55, but buyers will probably be waiting there. As long as the AVWAP (orange) from the Post-Election Day gap holds as support around $593.30, this lockout rally can continue. If that is broken, then the gap must hold at $585.41. If this level breaks, a gap fill may occur at $577 level.
The argument against the market continuing higher is that it’s too stretched from the 9 and 21 EMAs. Looking at the chart below, when SPY’s price moves too far above these EMAs, it typically either pulls back (a price correction) or consolidates sideways (a time correction) to allow the EMAs to catch up. SPY is at that extreme right now, which makes us wonder if it’s time for the market to catch its breath.
The NYSE Advance/Decline Line ($NYAD) is now on an uptrend to towards the Upper Bollinger Band. It may take a few days, but once it does hit the Upper Bollinger Band and probably makes a new high, we’ll have to watch out for signs of a pullback or a sideways consolidation. A Mid-November slowdown is quite possible, which would be a healthy opportunity for the $NYAD to reload and continue higher.
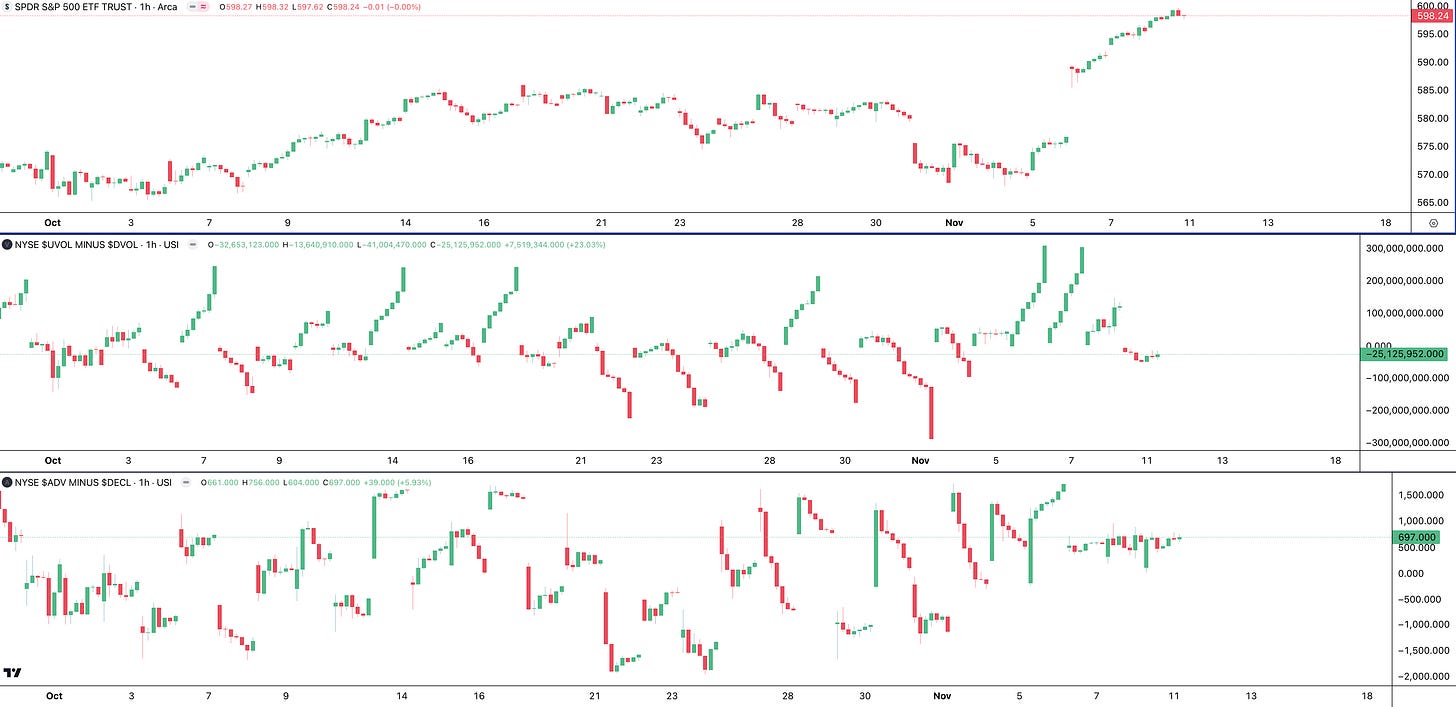
The chart below shows the SPY (upper chart), $VOLD (intraday Advance/Decline Volume, middle chart) and ADD (intraday Advance/Decline Issues, lower chart) on the 1-hour chart. Notice that after the election, VOLD spiked as institutions rushed to increase equity exposure, likely buying index ETFs like SPY or QQQ. However ADD is going sideways, telling us that institutions are still waiting to buy individual stocks. Meanwhile, on Friday, VOLD showed muted buying as SPY continued higher. It is possible that institutions are waiting for a pullback to add more equity exposure into individual stocks.
The following chart shows that Smart Money took profits into the recent highs and are now at a low. Meanwhile, Dumb Money pumped money into the market. Perhaps the possible dip we mentioned going into Mid-November may entice Smart Money to buy-the-dip.
Meanwhile, Greed found its way back into the market.
Next week brings a heavy slate of economic news, with CPI on Wednesday, PPI on Thursday, and Core Retail Sales on Friday. These events could significantly move the markets, so be prepared.
Below is an excerpt of our SPY Cycle Forecast for 4Q2024 and we have to say that it is providing pretty accurate guidance for the market.
In the Premium Section we’ll use the full SPY 4Q2024 Cycle Forecast as a guide to buy ETFs with relative strength under the new presidency. Mid-Week we’ll cover stocks with relative strength. You won’t want to miss this opportunity.
Disclaimer - All materials, information, and ideas from Cycles Edge are for educational purposes only and should not be considered Financial Advice. This blog may document actions done by the owners/writers of this blog, thus it should be assumed that positions are likely taken. If this is an issue, please discontinue reading. Cycles Edge takes no responsibility for possible losses, as markets can be volatile and unpredictable, leading to constantly changing opinions or forecasts.


