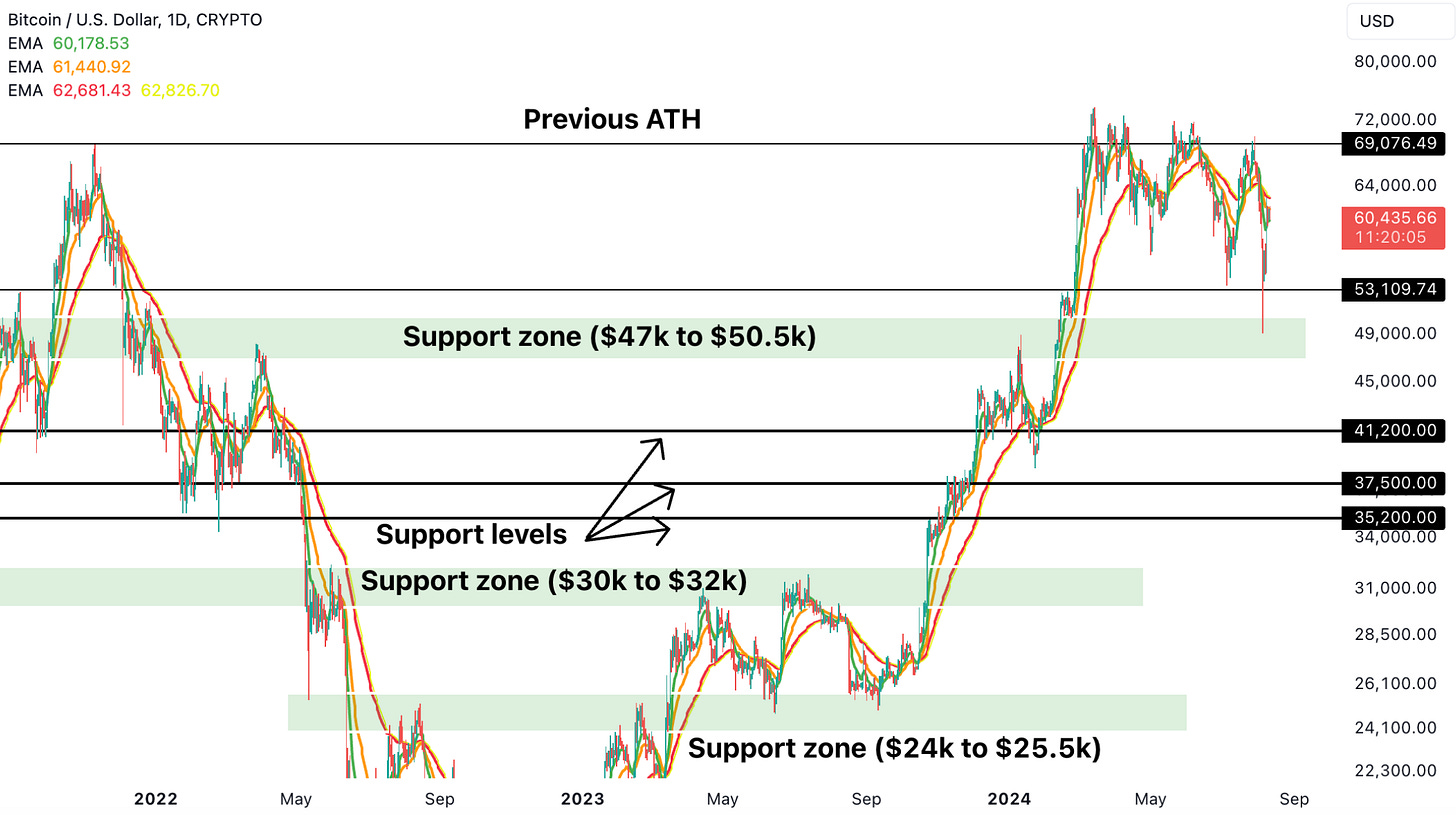
Last week saw “blood in the streets” with market participants throwing in the towel in fear of a recession and the Japanese carry trade unwinding (read more about it here). As a result of the aggressive sell-off, the Crypto fear and greed index plummeted to levels last seen during the FTX collapse (wasn’t that a great buying opportunity? This time is no different)
Bull Market Still Alive
A lot of people started calling for the end of the Crypto bull run, but forgot to wait for any type of confirmation signal to back up such a call. Bitcoin saw a large down wick that tested the 50-SMA on the weekly timeframe and then the buyers stepped in. This SMA is very important on the weekly timeframe to maintain going forward.
Back in Summer 2021, people started calling for the top being in, but the 50-SMA on the weekly was held. What happened next for a big rally that was able to make slightly new highs. It was only in late-2021/early-2022 when the 50-SMA on the weekly was broken and price got rejected from it. That’s when the smart money (taking into account other indicators) knew that the top was actually in for the previous Crypto bull cycle.
In the recent flush, Bitcoin dropped straight to the $47k to $50.5k support zone. Buyers were able to defend this zone even on the daily timeframe and make the price close comfortably above the $53.1k support level. This is clearly not a sign of the market top being in.
Bitcoin Relative To Nasdaq 100
As good as the run-up has been for Bitcoin since 2023, it has barely set a new ATH. Moreover, in relation to Nasdaq 100, Bitcoin has still not even done that. There’s quite a bit more left in cycle and we’re very confident in that call. Therefore, we’re going to continue to buy-the-dip and maintain our bullish posturing for now.
Ethereum Requires Time
Ethereum, on the other hand, saw a sharper sell-off that broke a couple of key support levels: $2854 and $2499. On the day of the sell-off (5th August), the daily candle closed below the $2499 support, and it took 3 more days before price was finally able to close above it. Currently, ETH is having a hard time getting above its 9-daily EMA and there’s no bullish divergences either that are signaling underlying strength is present yet.
In such a situation, it is often common for price to fill the capitulation wick with a candle close or to dip slightly below it, while forming a bullish RSI divergence. We’ll be waiting for a similar development to pounce on that opportunity. On the other hand, if ETH can reclaim the $2854 support level (and the 21-daily EMA that sits around that level), then its game back on for the bulls.
The overall ETH uptrend since the beginning of 2023 was held with pinpoint precision, so the game is far from over for the ETH bulls.
ETH/BTC Ratio Still Under Pressure
In terms of the ETH/BTC ratio, the ratio continues to be under pressure (BTC outperforming ETH) as the downtrend has been maintained since mid-2022. However, there are 2 signs that are promising under the hood:
1) There’s an RSI divergence that is potentially being formed
2) The ratio retested the 2019-2021 levels (around 0.0397 to 0.0413) and has formed a massive down wick on the weekly timeframe
Going forward, the 0.0397 level should hold on a weekly closing basis to indicate that there’s a potential trend switch in the ratio (from BTC outperforming to ETH outperforming) that might be coming. The next indication would be a reclaim of the 0.0449 to 0.0462 level. Finally, the trigger (that everyone would be watching) is the break of the downtrend line and into the green zone (that used to be support).
There’s another very important signal that was triggered in the recent sell-off, which was last seen right at the bottom of the 2020 pandemic crash. This is what we’re going to cover in the next section for our paid members. We’ll also analyze the intermarket dynamics at play – USD ($DXY) and another very important intermarket signal that signaled the onset of the most aggressive upside phase for Bitcoin in the last 2 bull runs. Lastly, we’ll cover our proprietary Cycles Forecast for Bitcoin and Ethereum to get a bias for August.
The Signal That Triggered During The March 2020 Bottom


