


Buy the Dip or Sell the Rip?
Premium Section: How to Trade the Rip-Your-Face-Off Market of 2025

Last Wednesday we mentioned that the stock market was extended and a pullback was possible. We anticipated a pullback to a moving average, which could create a buying opportunity. Instead, we saw a mini-crash, with the Nasdaq 100 (QQQ) dropping about 3% following news that DeepSeek, a Chinese artificial intelligence company, may have a competitive advantage over U.S. AI companies.
Is this a one-day event or the start of a new trend? Is it time to buy the dip, or has it become time to sell the rip?
Market Conditions: Extended Conditions Called for a Pullback
Looking at our Market Timer setup, the stock market was itching for a rug-pull. The Nasdaq 100 (QQQ) failed to make a new high as the CCI Indicator hit the overbought area. Meanwhile, the Nasdaq 100 Stocks Above the 20 SMA hit the red (overbought) zone as it’s CCI Indicator similarly hit the overbought area. Finally the VIX Curve (VXV/VIX) touched the overbought area of 1.20 and dropped. Market conditions pointed to a crowded bullish trade and was ready for a pullback.

This setup does leave a clue for the timing of dip-buying. When the VIX Curve touches or goes below the 1.00 mark and reverses higher, it may be time to re-deploy capital. Buying now may be a bit premature.
The NYSE McClellan Breadth Oscillator (NYMO) also tells us that it may be a bit too early to buy. Notice how the NYMO is turning down at the Upper Bollinger Band, as the RSI hit the overbought area. Waiting for breadth to rise again would be beneficial to new equity positions.

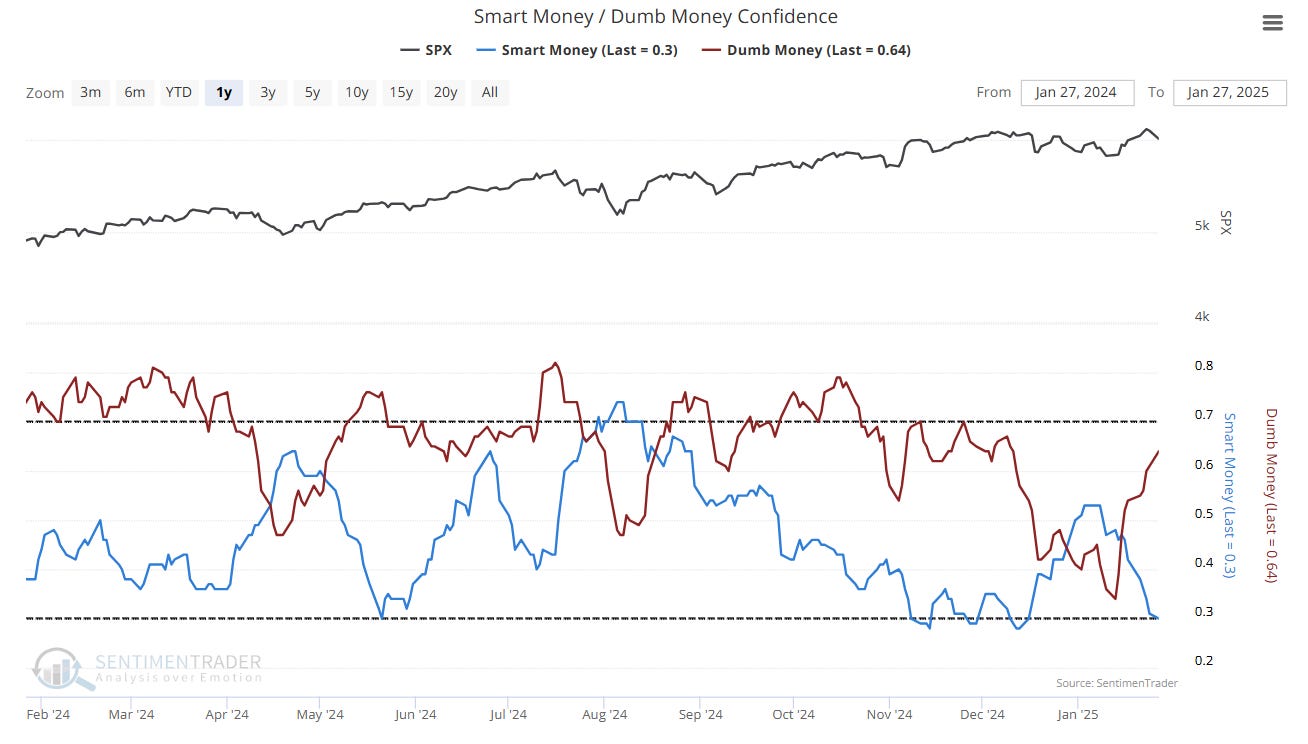
The Smart Money/Dumb Money Confidence model shows Smart Money selling at the highs while Dumb Money (retail) bought in heavily. This provides further evidence that the bullish trade had become crowded—always a prime setup for market makers to pull the rug.
The Stretch Indicators Say…
The S&P 500 (SPY) dropped to the 20 SMA, which is currently finding buyers. Notice the heavy buying volume. This level also aligns with a 50% Fibonacci retracement of the rally that began on 1/13/25. So far, the market has made a higher low, indicating that the uptrend remains intact. A close above the 9 EMA (pink, currently at $600.15) would confirm that the uptrend is continuing. Alternatively, the price could move lower until it becomes stretched to the downside relative to the moving averages (green lines). This would eventually create a buying opportunity, as price consistently gravitates back to the 9 EMA.

The Nasdaq 100 (QQQ) was hit the hardest of the indexes and fell below the 20 SMA. The descent stopped at the 62% Fibonacci Retracement area, where a significant number of buyers came in. This is still a higher low, so the uptrend is still intact. If this is the bottom, the next step is for QQQ to retake the 20 SMA at $518.25. If it continues lower it may soon become stretched from the 9 EMA, where bounces often occur.

The Dow Jones (DIA) was pretty unscathed as it has a lower exposure to technology stocks. It broke below the 5 SMA (black) and bounced up hard closing up for the day. DIA’s relative strength is also driven by the resurgence of the Healthcare, Financial and Consumer Staples sectors. DIA’s uptrend has not even been challenged.

The Russell 2000 (IWM) also showed relative strength as it held the 9 EMA near the 23% Fibonacci Retracement level. However it is still struggling to find buyers. So far it is still making a higher low so we’ll have to see if buyers step in to break above the $230 resistance area.

The Stretch setup told us to expect a pullback. We got that. Now, today’s low must hold, otherwise look for price to get stretched from the 9 EMA on the downside, setting up the next long trade.
What are Bonds Telling Us?
Bonds are often a forward indicator for stocks. For example on 12/12/24 treasuries (TLT), investment grade corporate bonds (LQD) and high yield bonds (HYG) all fell into a downtrend below their 20 SMA. The SPY followed suit on 12/18, four trading days later. Now we see that the bonds are continuing on an uptrend. This bodes well for stocks. Bonds are telling us that despite the volatility, the SPY will continue higher.

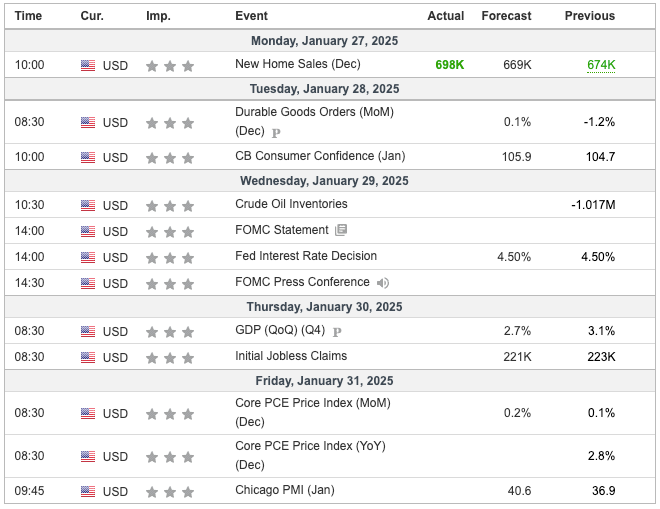
How confident should we be in a continued uptrend? This week brings a heavy slate of economic data releases, including an FOMC meeting on Wednesday, GDP on Thursday, and Core PCE on Friday. Markets could reprice quickly, as these events will play a pivotal role in determining the next direction.
In the Premium Section we’ll go over the best way to trade this vicious market. We’ll also apply this strategy to the markets going forward.
Disclaimer - All materials, information, and ideas from Cycles Edge are for educational purposes only and should not be considered Financial Advice. This blog may document actions done by the owners/writers of this blog, thus it should be assumed that positions are likely taken. If this is an issue, please discontinue reading. Cycles Edge takes no responsibility for possible losses, as markets can be volatile and unpredictable, leading to constantly changing opinions or forecasts. All sales are final.