The stock market got the jitters last week ahead of the FOMC meeting on Wednesday 3/20. Although the Fed Watch Tool has a 98% probability of no rate change, the market appears to be afraid of Fed Chair Powell’s comments regarding the recent uptick in inflation, as both CPI and PPI came in hotter than expected last week.
Last week there was a significant profit-taking in technology, which had a fantastic multi-month run. Semiconductors (SMH) was down 3.18% for the week, significantly weaker than the broader market as the S&P 500 (SPY) was down 0.37% for the week. Real estate, an interest rate-sensitive sector, also pulled back hard.
Technical Analysis
After rising for 18 weeks, the S&P 500 (SPY) shows signs of exhaustion in the Intermediate Cycle. Remember that Intermediate Cycles typically last 18 to 25 weeks. A multi-week pullback could be healthy for the market and allow it to reset and start a new Intermediate Cycle. A pullback to the 10-week Exponential Moving Average (EMA)at $498 or 21-week Exponential Moving Average at $481 could produce a buyable pullback. Similarly, a pullback to the 23% Fibonacci Retracement at $492 or 38% Fibonacci Retracement at $477 could also be areas of interest.
The SPY appears to be making 52 bar (trading day) cycles as shown by the cycle brackets below. There is typically a counter-trend move in the last 25% of the cycle bracket. For an uptrend, that would mean a pullback. The pullback may have begun last week and could continue until late March to early April. The Relative Strength Index (RSI) indicator shows a pattern of making new lows after a long divergence. The McClellan Oscillator is negative, and the Net New Highs are drying up. These measures point to weakening breadth. March 28th could begin a new cycle, and we believe it will also be an up-cycle, however it may not be as strong as the previous two 52-bar cycles.
Friday’s close held the 21 EMA, which has been the moving average that guided this entire uptrend. It is possible that a strong bounce could be produced from this support level. However, since we are late in the Intermediate Cycle, and there have already been many touches of the 21 EMA, we believe it’s due for a break. The high selling volume on Thursday and Friday also supports the idea of more weakness. The FOMC coming up on Wednesday is the event that should provide definitive action.
The S&P 500 Bullish Percent Index is a breadth indicator that works like an oscillator. It is pointing to more downside as it broke below the 10 EMA (blue line). Moreover, it’s RSI shows a bearish divergence that led to a downside break. This could continue to fall to the 30 mark unless is can produce an uptrend.
The Nasdaq 100 (QQQ) was hit with profit-taking on high volume on Friday as it closed below the 21 EMA. This is a significant break of trend if it stays below the 21 EMA. A new cycle begins around 4/3, but before then, more selling could occur. Let’s keep an eye on the 23% Fibonacci Retracement level at $423 and the 38% Fibonacci Retracement level at $407 to see if buyers return.
Falling Leaders
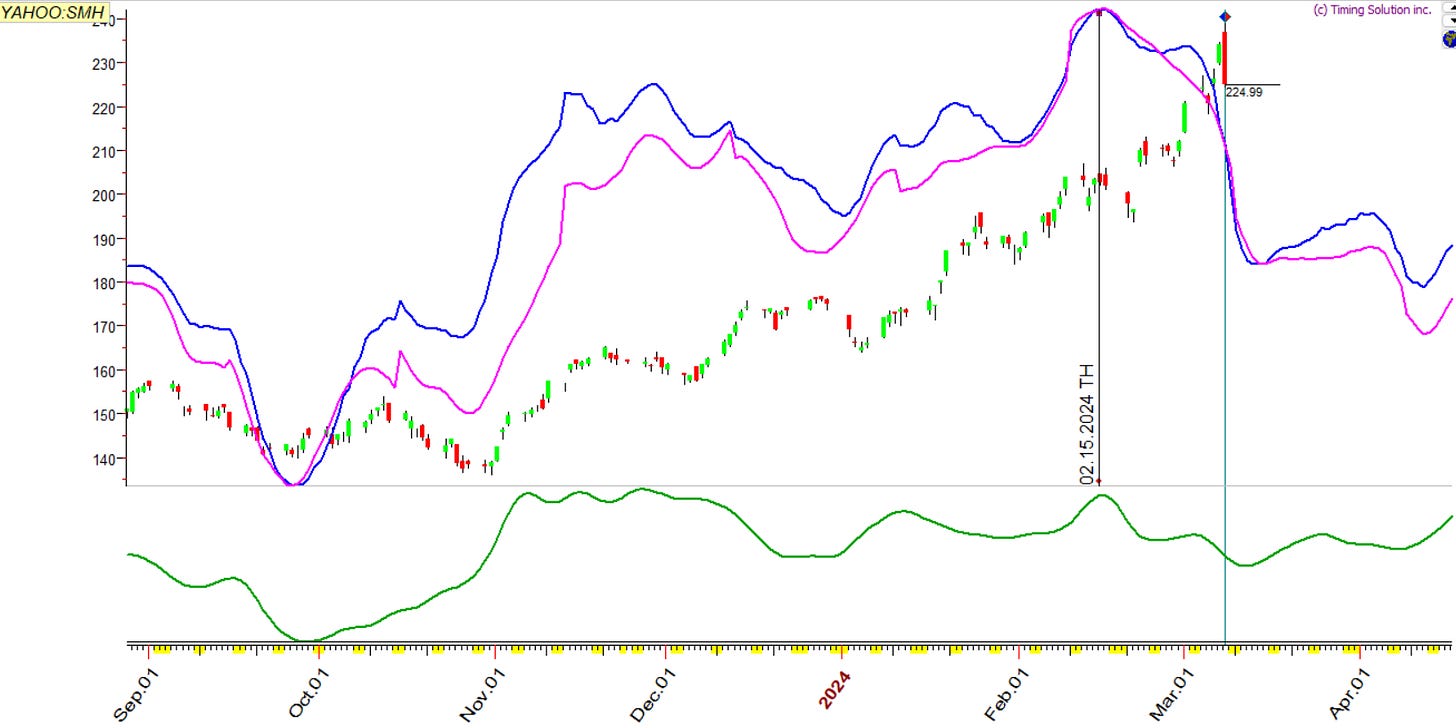
Our Cycles forecasted profit-taking in Semiconductors (SMH), and although it is late, it seems to be occurring now.
SMH fell 3.18% for the week but is currently finding support at the 21 EMA. The RSI indicator is in a downtrend as the MACD indicator made a bearish crossover. SMH is currently following a 26-bar cycle bracket and is facing weakness in the tail end of the cycle bracket. A new cycle begins around 3/27 so weakness could be bought soon.
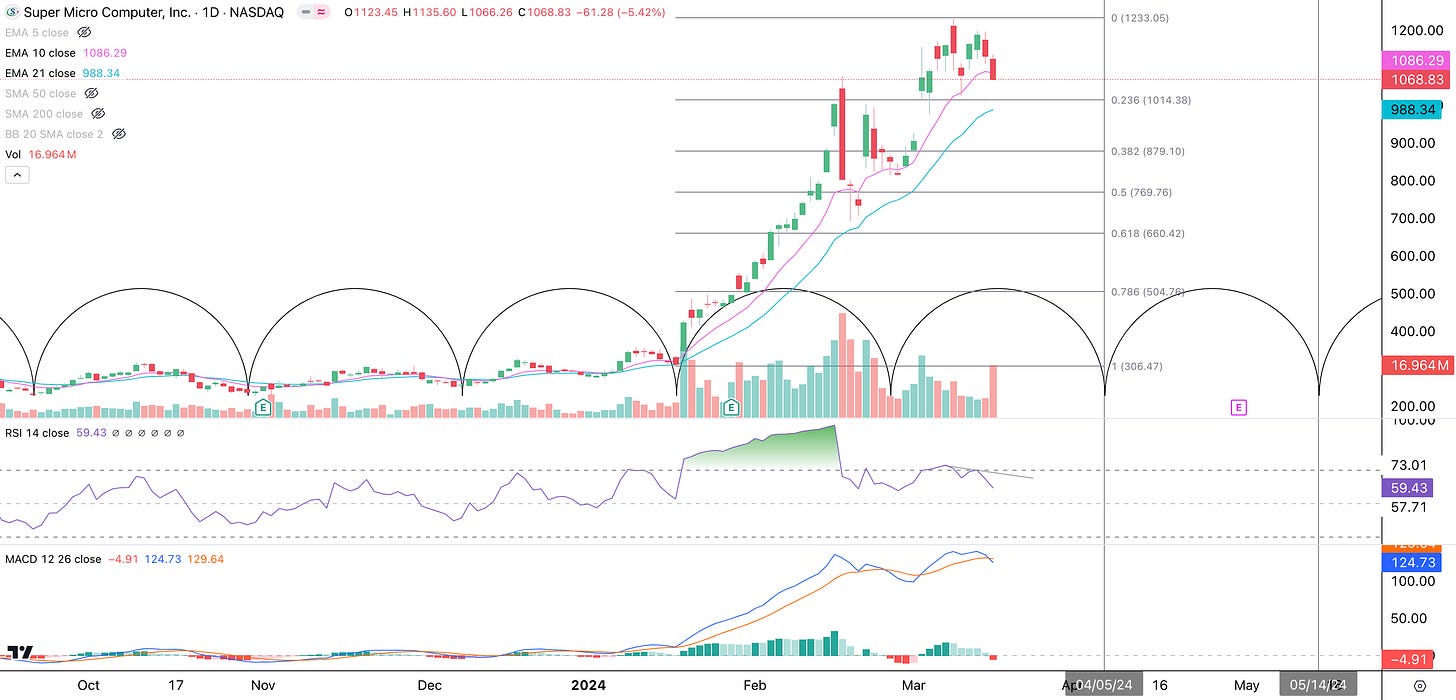
SMCI has a similar look as it faced heavy selling volume, pushing it below the 10 EMA (pink line). It’s also facing a down-trending RSI and a bearish MACD cross. Let’s see if the 21 EMA at $988 or the 23% Fibonacci Retracement at $1,014 could hold as support. Look for a new cycle beginning 4/5.
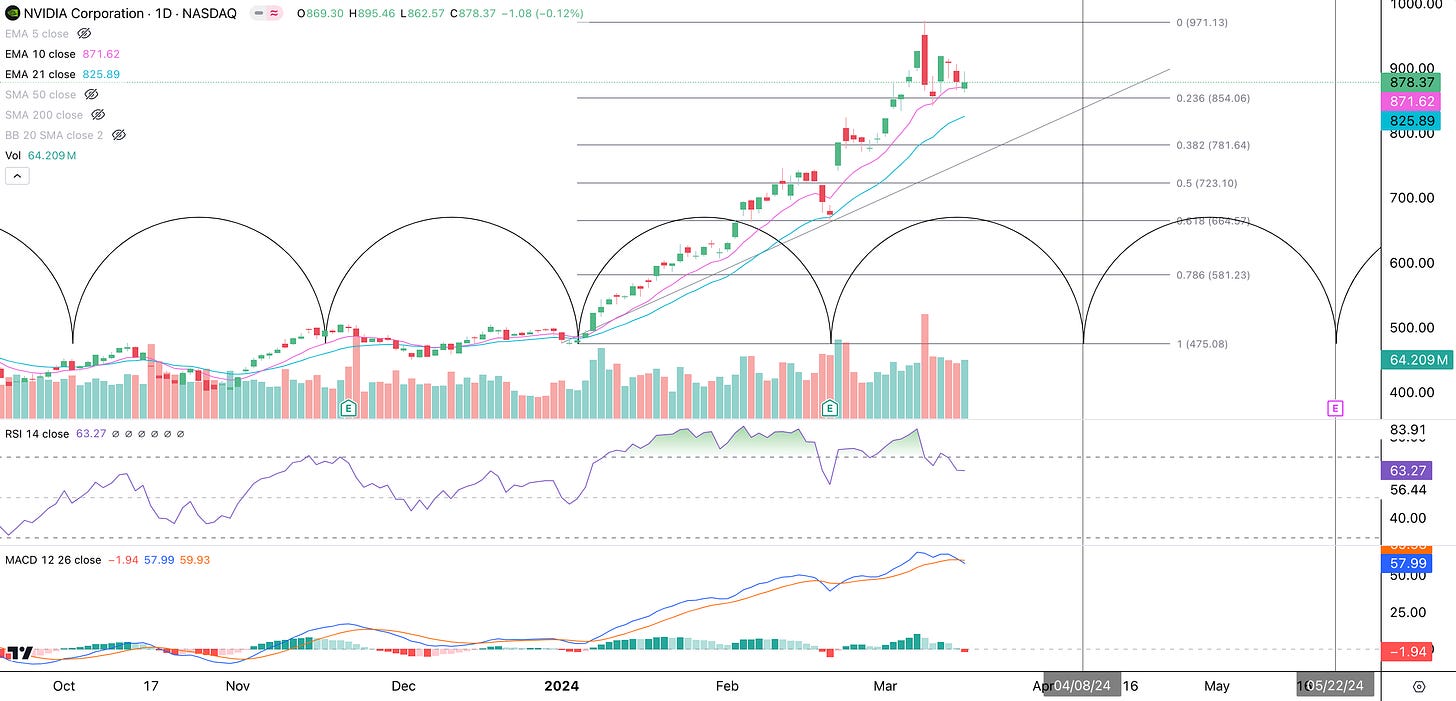
NVDA pulled back from all-time highs to the 10 EMA, which pretty much also coincides with the 23% Fibonacci Retracement. Buying volume on Friday was significant so let’s see if the 10 EMA holds. If not, the next stop would be the 21 EMA at $825. A new cycle may begin around 4/8.
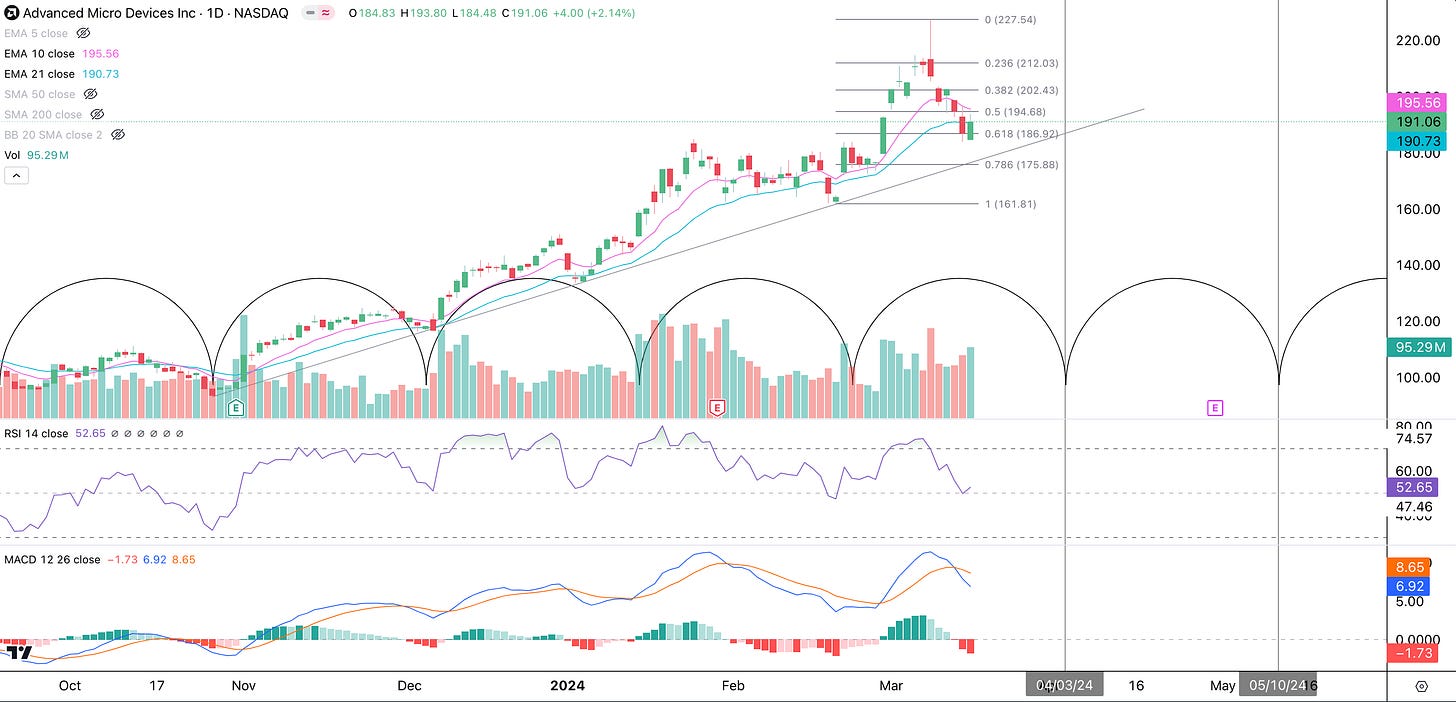
AMD fell almost 8% last week. Looking at the cycle bracket, it seems like we have a “left translated cycle”, where the peak occurred before the halfway mark. This marks a weak cycle and more selling is possible. Profit-taking already pushed the price down to the 62% Fibonacci Retracement, however buyers appear to be stepping in here. A new cycle will begin around 4/3 so let’s see if more buyers come back in then.
Conclusion
The week after options expiration (next week) often encounters weakness, so be careful next week. The end of March should bring renewed buying for the Easter Rally. We are working hard on our Q2 2024 Cycle Forecasts, and we are fine-tuning our cycles to make them more accurate. Have a great week and we’ll let everyone know when our Q2 2024 Cycle Forecasts are available next week!
Disclaimer - All materials, information, and ideas from Cycles Edge are for educational purposes only and should not be considered Financial Advice. This blog may document actions done by the owners/writers of this blog, thus it should be assumed that positions are likely taken. If this is an issue, please discontinue reading. Cycles Edge takes no responsibility for possible losses, as markets can be volatile and unpredictable, leading to constantly changing opinions or forecasts.
Premium Section:
The “Swing Traders’ Market appears to be over for Large-cap Growth stocks. That is unless the QQQ bounces back above the 21 EMA. Small-cap growth is currently hanging on above the 21 EMA, but next week’s action should confirm. This is a change in complexion so it’s important to be more cautious.
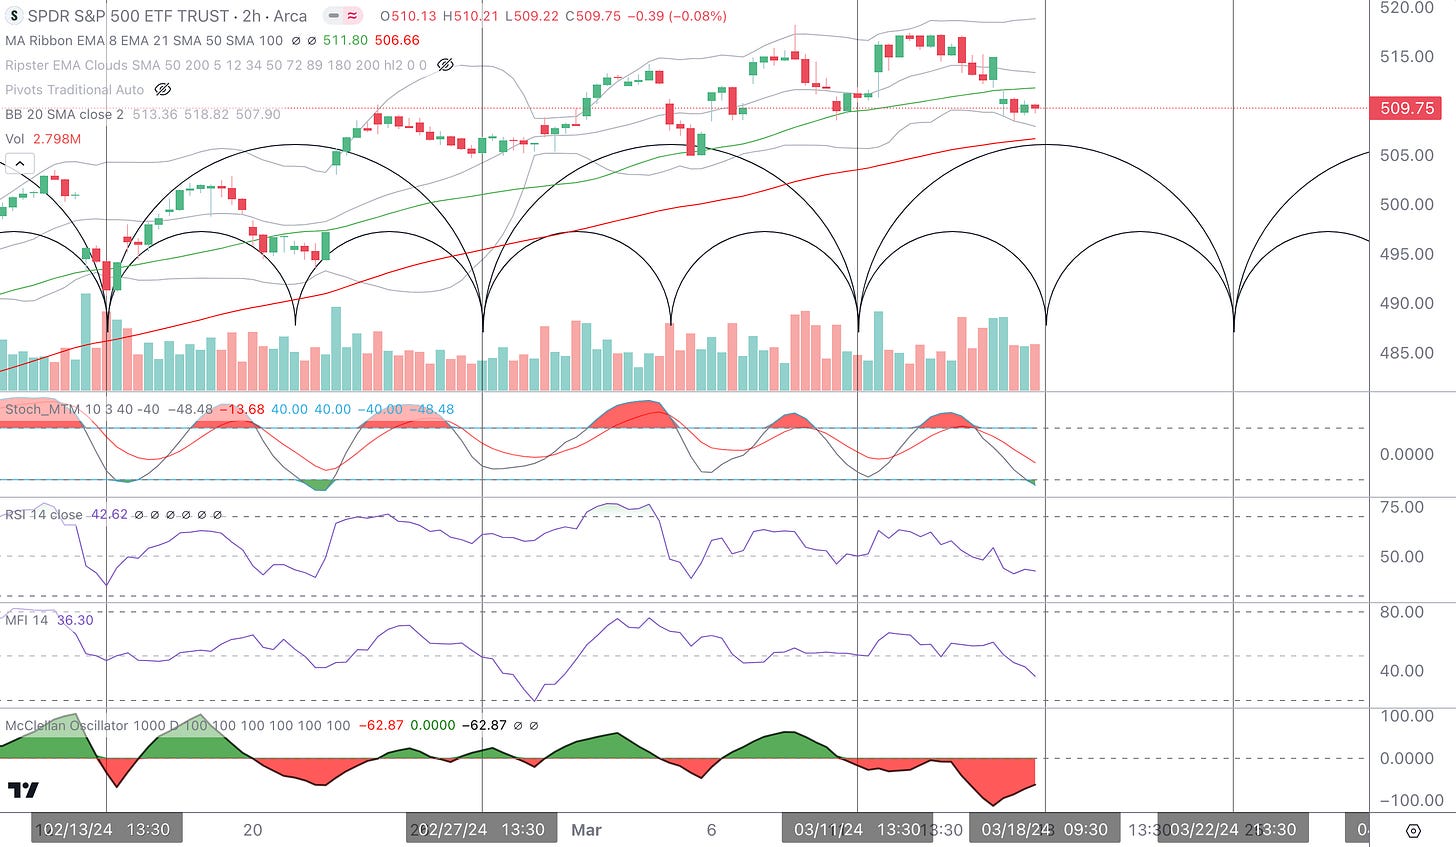
Meanwhile, the 2-hour Cycle Brackets continue to work well. On 3/18 there could be a buy point for the SPY. To confirm this buy point, price should get above the 50 SMA around $512 with strong volume. This cycle may stall until the FOMC and there is the possibility that it is a negative one in case Fed Chair Powell spooks the market.




Hello Cycles Edge team,
I'm Mathias from Germany and I purchased a yearly subscription a couple of days ago.
Please take a detailed look at the German DAX (Europe's most important and most traded equity-index) and kindly share your analysis as soon as possible.
Thank you in advance and keep up the excellent work!
Mathias