Key Market Developments
Japan’s Central Bank recently parted ways with their negative interest rate policy after hiking interest rates this month. Such a move has caused widespread panic amongst investors as the carry trade is squared off (more about this can be found in a recent article that we published here). This move is likely to put downward pressure on risk-on assets, so make sure to protect capital during such an environment until the storm settles.
On the other hand, the labor market data recently came in much weaker than expected. This has sparked recession fears again. We’re keeping an eye on multiple different economic indicators (like the yield curve, unemployment rate, jobless claims, non-farm payrolls, leading and coincident economic indicators, etc.) to time the recession well.
In our opinion, it’s still too early to call for one (although that could change if the data continues to worsen at this rate by the end of September). But the reason we want more evidence from the labor market is because there’s an argument to be made that the Hurricane Beryl has heavily impacted the labor market data that was recently released.
However, one thing is nearly certain – there’s at least a 25 bps (if not 50 bps) rate cut coming in the month of September. This should put downward pressure on yields and USD, both of which should be beneficial for Gold and Silver.
Gold Technical Analysis
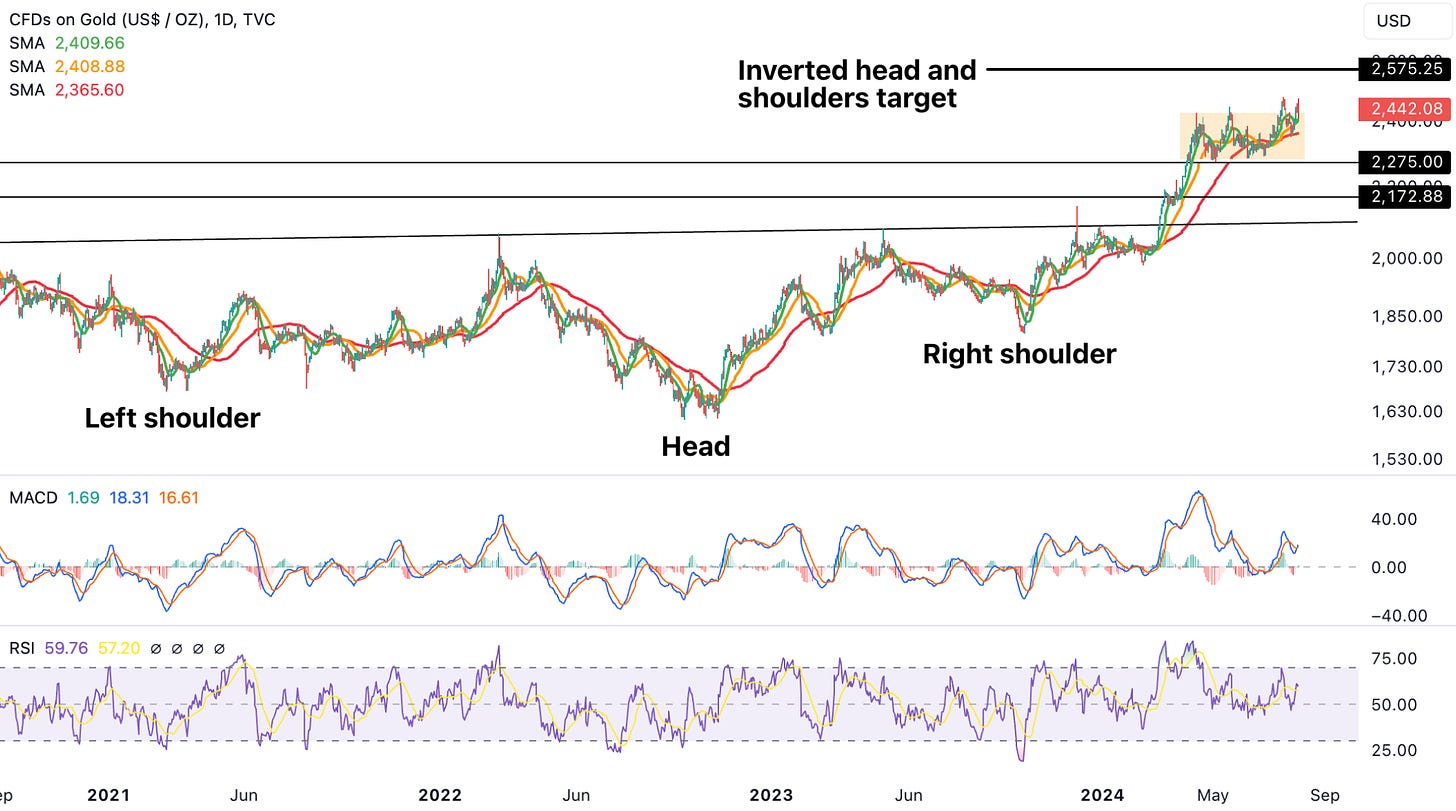
Throughout this period, Gold has continued to show strength. Price is above the 9, 21 and 55-daily EMAs with a fresh bullish MACD cross and a lot of upside room on the RSI. Gold did re-enter the orange consolidation zone (highlighted in the chart below) since our last update (found here), but was able to quickly escape it again.
We’re pretty confident on the $2575 inverse head and shoulder level being hit fairly soon. This is a level we’ve highlighted multiple months ago and our members have continued being on the right side of Gold throughout this period. We’ll re-evaluate our outlook once this level has been officially hit.
Silver Technical Analysis
Silver, on the other hand, has been unable to replicate Gold’s strength. Silver has fallen below the key $28.84 support level and has been unable to reclaim it ever since. There are 2 potential outcomes from here:
A) A confirmed reclaim of $28.84 support level, which would make the current breakdown a simple deviation. This would be incredibly bullish and would set the stage for the May highs to be broken
B) A rejection now at $28.84 support level, which would result in the next support level at $26.13 being into play. IF this were to happen, it would lead to short-term pain (and a buying opportunity), but the weekly bullish trend would still be very much intact
Silver/Gold Ratio
Silver/Gold ratio has retraced back to the downtrend line that was broken in June 2024. We’ll have to watch this chart closely to see if this is a simple retest or the ratio confirms a break back below the downtrend line. The former would mean Silver is setting up to significantly outperform Gold, whereas, the latter would mean that Gold’s outperformance is going to persist for more time now. Instead of guessing a direction, it objectively makes sense to wait for the ratio to lead us to a bias, so that’s exactly what we’ll be doing.
Copper Technical Analysis
Copper has had quite a pullback since late-May and now hovers right above the support zone between $3.92 to $4.02. This is a very important region for Copper to hold, otherwise it would start to indicate significant worldwide economic weakness at play. For now, Copper doesn’t believe that a worldwide recession is coming, given that Copper still had a green day following the weak US labor market release on Friday. It’ll be important to see how Copper does this coming week though.
On the other hand, the key level to reclaim is $4.35. Such a move would indicate that Copper’s current drawdown was just an overextension to the downside, similar to how the move up earlier this year got overextended to the upside.
In the next section (for Paid Members only), we’re going to cover a very important signal that has flashed for Gold, Silver and Copper. We’ll cover this signal from a statistical standpoint in order to understand the odds of upside for these 3 assets across short and medium-term timeframes. Our paid members will also get our proprietary Cycles Forecast for all 3 assets for August in order to prepare for what’s to come. Lastly, we’ll cover (in a follow up piece) the outlook for Gold, Silver and Copper miners.


