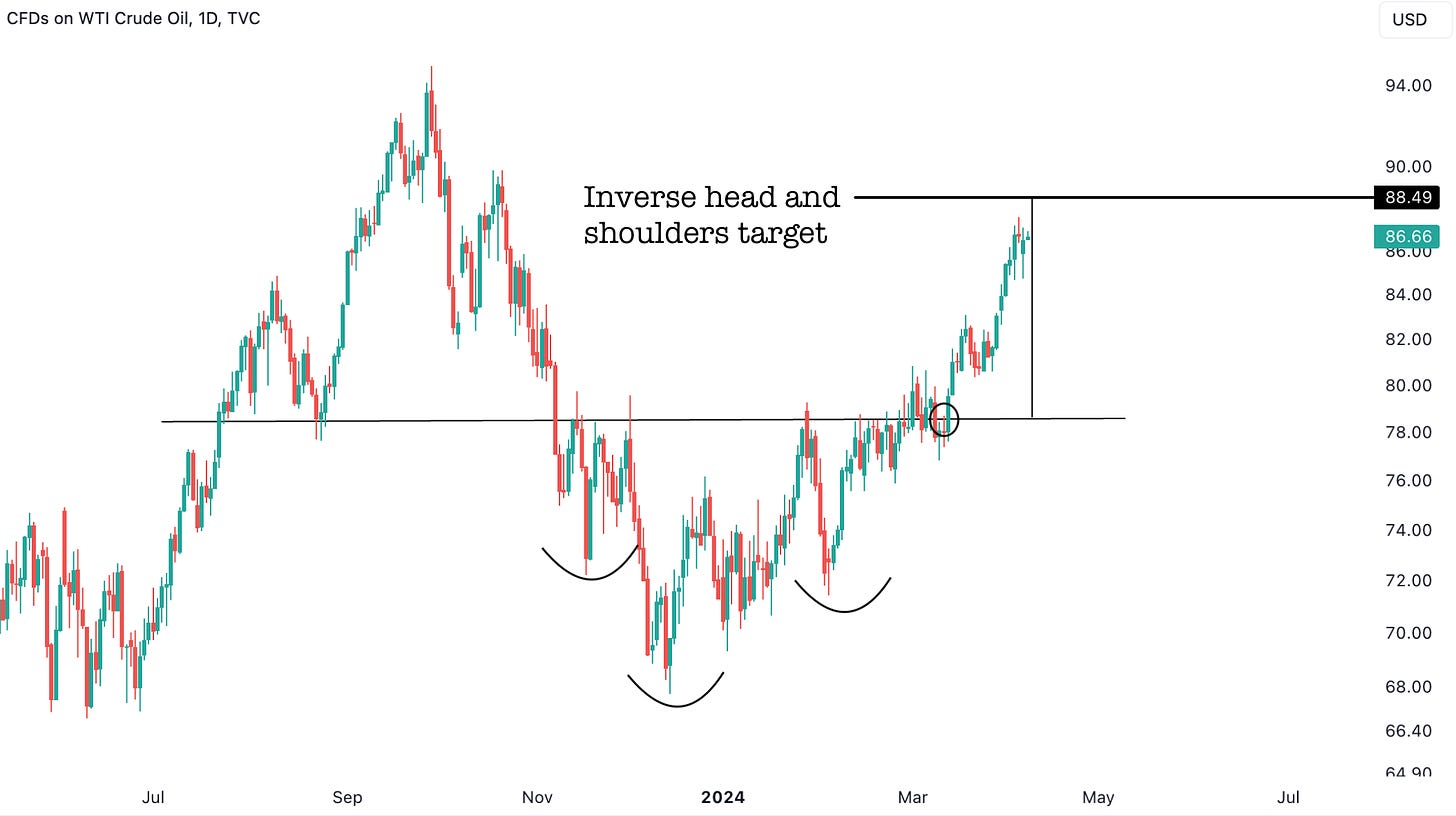
In our previous Oil article (found here), we had highlighted the inverse head and shoulders breakout with an upside target of $88.49. Oil is now less than $2 away from that target. But is this the start of something bigger, especially with other Commodities like Gold, Silver, Copper, Cocoa all showing aggressive upward price action?
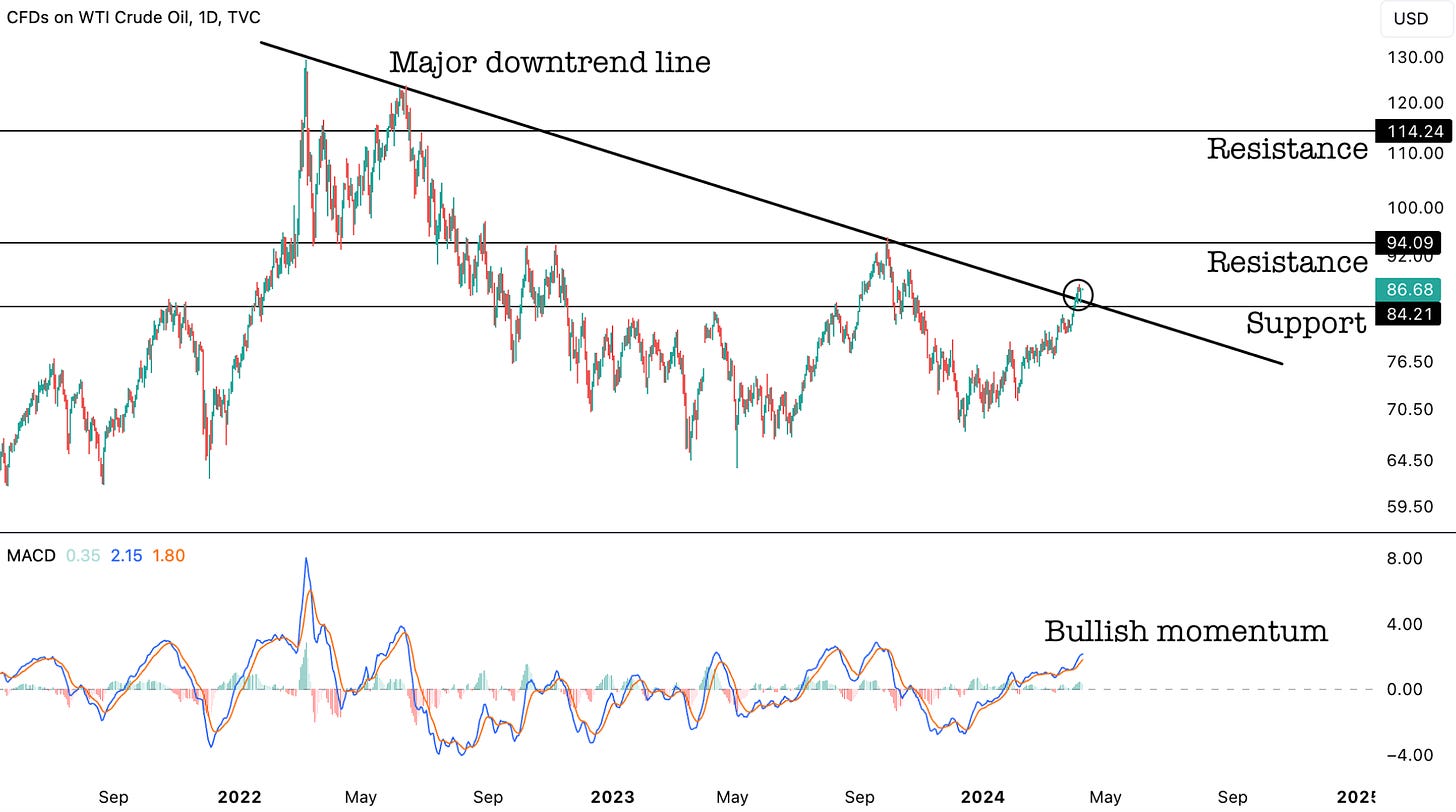
The current move in Oil has led to a breakout of a major downtrend trendline. If the $84.21 level holds, which is very likely at this point, then $94.09 is the next upside level. While a slight deviation is possible of the $84.21 level, we believe the $94.09 level should be reached in the coming months based on our Cycles Forecast that we highlight later in this article.
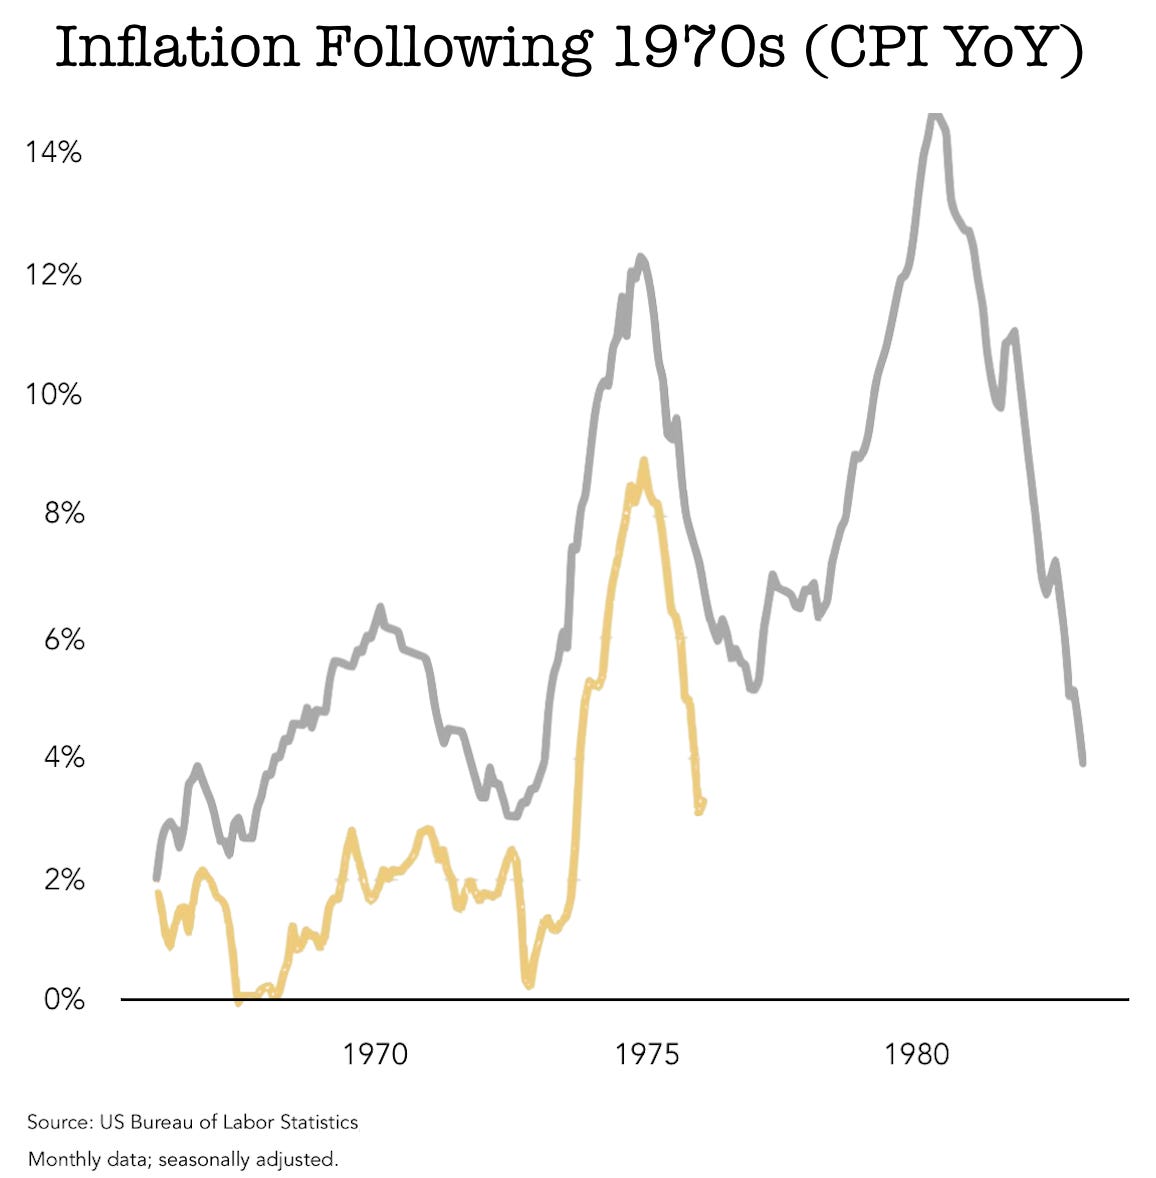
However, with Oil staging such a move, is the economy nearing the risk of experiencing a second wave of inflation like the 1970s? While we don’t have the answer yet, this is something to keep a close eye out for, especially with Gold (an inflation hedge) making a big move up.
But how do we know this move in Oil is real? That’s exactly where intermarket analysis comes into the picture, which we cover in the next section for our paid members. We’re also going to look at the Cycles Forecast until 1st May 2024 through our propriety method for Oil. After that, our members are going to get a +90% profit making setup in another Energy-related commodity, which will be backed up by our propriety Cycles Forecast for that commodity. Lastly, we take a look at basic Macro to better understand the current state of the economy. Time to dive in!
We recently released our Q2 2024 Cycles Forecast for multiple different asset classes and equity names. This also includes commodities from the Energy space like Oil. The introductory article for the quarterly Cycles Forecast can be found here. Please note that our Founding Members have now been emailed these Cycles Forecasts (the full deck covering every name!). If you would like your copy earlier for the next quarter, please consider upgrading to a Founding Member status on our Substack.


