Ride the Technology & Artificial Intelligence Wave
Once Again the Market Chooses Tech Excitement over Macro Misery
Last week we saw that the stock market was in a contractionary phase and expected the catalysts of the Fed meeting or Mega-Cap earnings to ignite the stock market into a new expansive phase. That is what happened, but there was a twist.
At the FOMC meeting on 1/31 Fed Chair Powell popped the market’s hopes for 5 to 6 quarter-point rate cuts in 2024. He reminded us that inflation was not fully under control yet. He also noted that the highly expected first rate cut in March was “not the most likely case or what we would call the base case”. This sent the S&P 500 (SPY) down 1.63% and the Nasdaq 100 (QQQ) down almost 2% as the market now expects the first rate cut to come in May.
The next day the market completely forgot about this macro gloom and rallied on META and AMZN reporting earnings on 2/1 after the close. The following day (Friday 2/2) the SPY continued 1.05% higher as META popped 20% and AMZN popped almost 8%. This rally occurred after Non-Farm Payrolls came in hot, supporting the argument that inflation is not under control.
Takeaway: The market is in the mood to focus on making money through Technology and Artificial Intelligence and is content to brush aside nagging macro concerns.
Market Conditions: A Narrowing Rally
The S&P 500 (SPY) continues higher above all moving averages as the rough FOMC meeting could not derail the bullish trend. Liquidity and breadth are decreasing, however, hinting that this rally may be getting old. We continue to get Net New Highs, but notice that the rate of New Highs is slowing, while the rate of New Lows appears to be accelerating. The McClellan Oscillator and Advance/Decline Line both showed weakening breadth, even as the market surged over the past two trading days. The VIX continues to stay low telling us that there is little fear in the market. The Put/Call ratio does show renewed put buying recently. Perhaps that was trap fuel to power the market higher.
Looking at the Bullish Percent of S&P 500 Stocks indicator, it appears that there is a breadth divergence going on. From the start of 2024, as the S&P 500 moved higher (upper pane), as breadth moved lower (main pane). This is evidence that the rally is narrowing and fewer stocks are participating in the rally. It could also be a precursor to a future pullback. This dynamic of declining breadth may continue for a while as the RSI usually makes multiple lows before a reversal. Furthermore, last year the trend of lower breadth only changed when the MACD indicator hit -7.5, and we are not there yet. History does not have to repeat itself, but it’s good to be mindful of past patterns.
The Intermarket picture is getting a bit suspect. The 10-year Treasury rate (TNX) and US Dollar (DXY) rose on Friday as the stock market rose. Typically a rising TNX and DXY provide a downward pressure on stocks. If the trend of rising rates and rising US Dollar continues, it could undermine the rally.
Cycles & Seasonality
In the case that a pullback is in the cards, it could follow the S&P 500’s Dynamic Cycle or the Presidential Cycle.
If we get a pullback following the S&P 500’s Dynamic Cycle it could begin around 2/7 and last until 2/16. Note that “Dynamic Cycles” are the most active and influential short-term (days) and intermediate-term (weeks) cycles in play. The pullback could serve as a buying opportunity for the next leg higher that could come around 2/16 and last until 3/17.
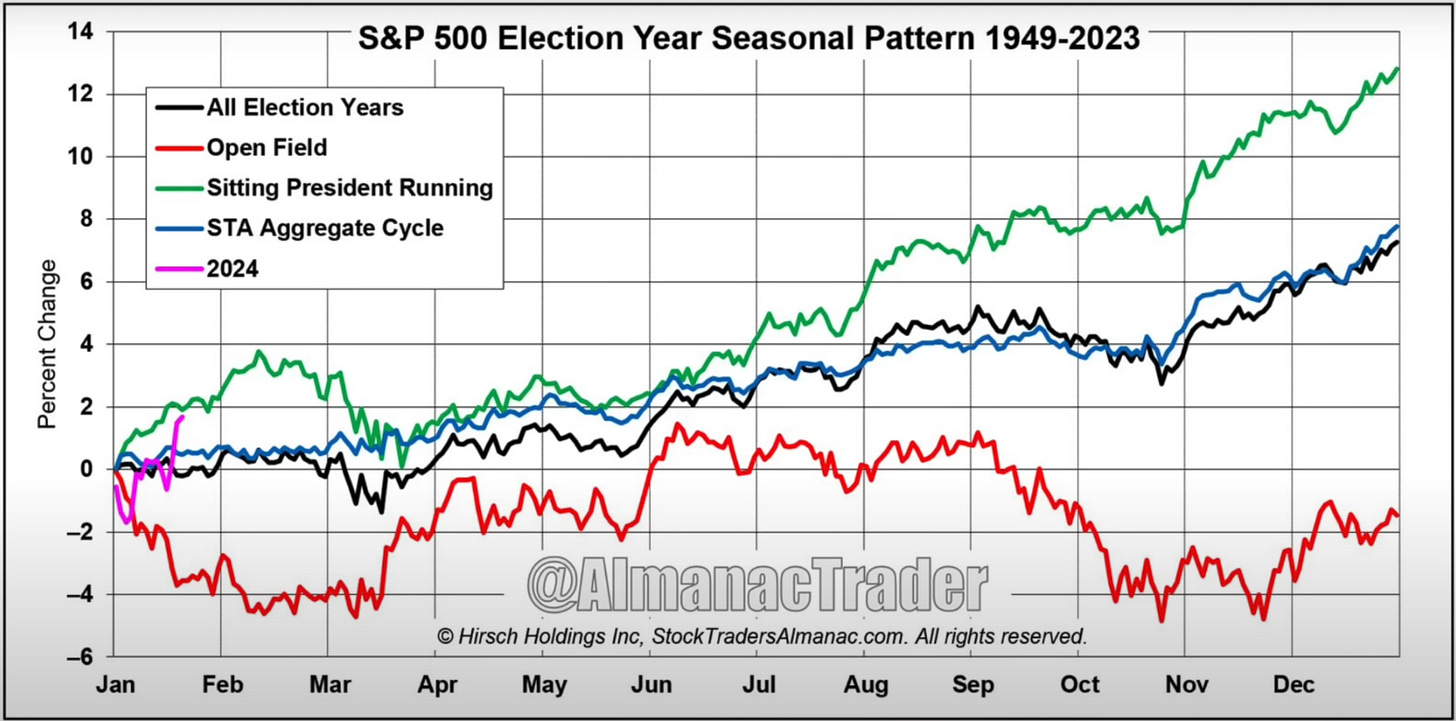
If a pullback follows the Presidential Cycle, it could follow the “Sitting President Running” scenario. This would bring weakness in mid-February, which could last until mid-March. Again, such a pullback would be a great opportunity for the next leg higher which could begin mid-March and last until the end of April in this scenario.
Conclusion
The rally powers on despite narrowing participation. The market’s eye is on opportunities in technology and artificial intelligence and is overlooking macro news. The strength of the market is noticeable and down-cycles or pullbacks could be buying opportunities. To optimize return, traders or investors could buy pullbacks in the top tech stocks.
The Technology & Artificial Intelligence Opportunity of 2024
Regardless of what the greater stock market is doing, I believe that it’s important to focus on the Tech & AI leaders this year to optimize return. The AI Boom is in its Introductory Growth Stage, where no one can accurately quantify or value the impact of the theme. This is typically where speculation and bubbles occur. This Tech Boom Version 2.0 is different from the one that occurred in the late 1990s because right now the AI innovation is being done as product arms of established companies with reasonable valuations, rather than broke new companies with sky-high valuations. Both NVDA and MSFT have Forward Price/Earnings ratios of 31x, which is reasonable relative to their market opportunity. Let’s go over a few leaders now and discuss a few more in the Premium Section.
To trade the top growth stocks it’s best to buy pullbacks to the 8 or 21 Exponential Moving Averages (EMA) or 50 Simple Moving Average (SMA). To lock in profit, one could trail-stop one of the moving averages, where I believe the 8 or 21 EMAs are best. It’s important to remember that when the party is over, the top story growth stocks often give it all back or give back a high percentage of their gains. By entering on a pullback to a moving average and trail-stopping on a moving average, one could partake in the party but skip the hangover and protect profits. Looking at the chart of ASAN below, the stock increased 460% over 188 days (131 trading days) and ended up giving it all back. What a run and what a hangover!
SQ ran up 795% over 505 days (349 trading days) but gave back most of the gain.
Remember to: 1) buy on a pullback, 2) trail stop on the 8 or 21 EMAs and 3) cash out and walk away when the party is over.
SMCI is currently the Large Cap Leader with a YTD return of almost 104%. This stock could be bought on a pullback to the 5 EMA (black line) and a trailing stop could be set below the 5 or 8 EMA (note that the 8 EMA is the pink line). A pullback and bullish crossover on the Full Stochastics indicator could confirm a buying opportunity. Also, note that the Money Flow Indicator is in the overbought area, so a pullback is possible.
The chart below shows the Dynamic Cycles for SMCI. If this is correct, there could be a cycle low coming up around 2/29 and an upthrust could follow until 4/23.
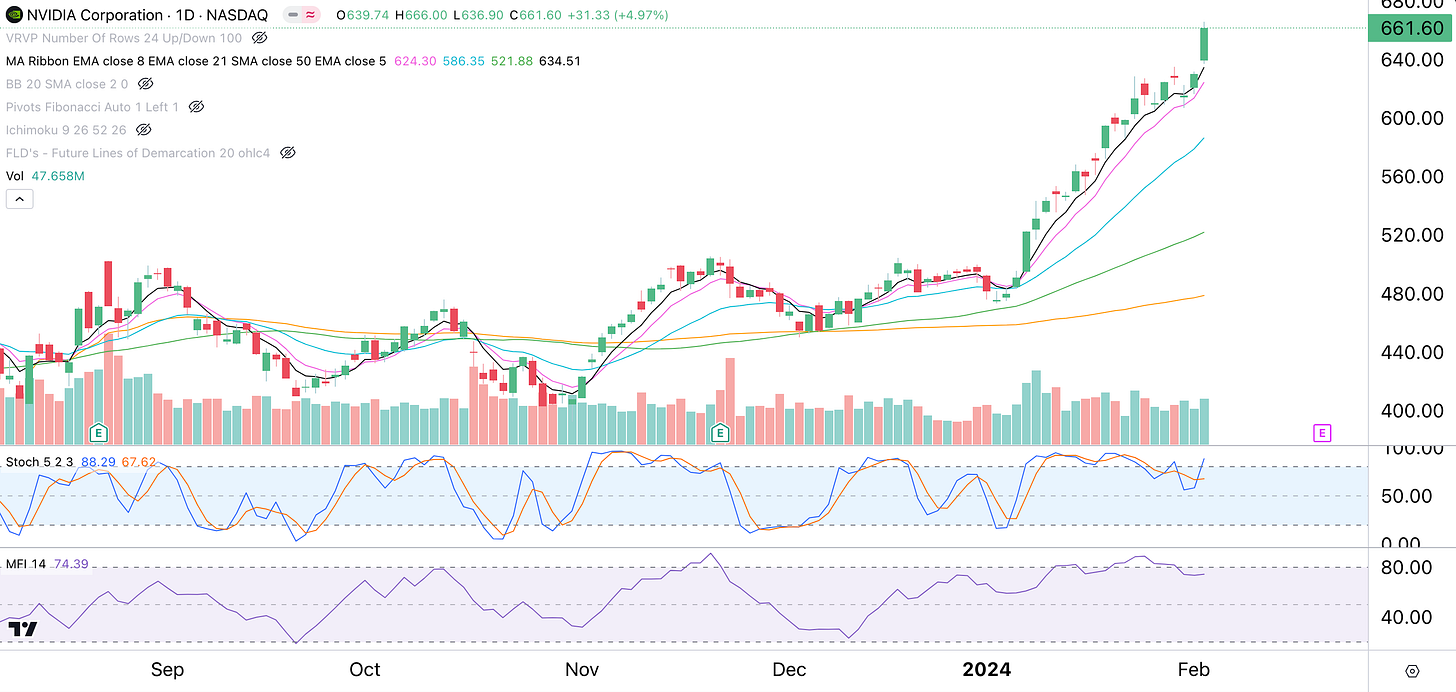
NVDA is the backbone of the AI Boom and is up 33.6% YTD. It is a bit extended at the moment, but a pullback to the 5 EMA or 8 EMA could be bought. There is a bit of negative divergence on the Money Flow Indicator, so a pullback to the moving averages is quite possible.
The Dynamic Cycle forecast for NVDA below shows a cycle low around 2/21 and 3/27, both of which are followed by up-cycles. Note that cycles show time and not degree, so price could move a lot even in what is seen as a short up-cycle.
META was the star on Friday as they reported better-than-expected guidance, a stock buyback, and their first-ever dividend. The stock is technically extended, but a pullback could be bought, with a stop at the low of Friday at $453.01. Alternatively, META could be purchased when the 5 EMA catches up with price. As always, set a trailing stop under a moving average.
The Dynamic Cycle for META shows that a pullback is possible until 2/22. However, if this is an inverted cycle (cycle points down, but the price goes up), the up-move in META could last until 2/22. With META it is most important to see if follow-on buyers enter, or if people take profits. Nonetheless, 2/22 is a cycle turning point, similar to 3/11 and 3/21 and these dates could pose as opportunities when paired with the technical chart.
For Paid Subscribers, we’ll go over MSFT, AMD, NFLX, CRWD, and PANW.
Disclaimer - All materials, information, and ideas from Cycles Edge are for educational purposes only and should not be considered Financial Advice. This blog may document actions done by the owners/writers of this blog, thus it should be assumed that positions are likely taken. If this is an issue, please discontinue reading. Cycles Edge takes no responsibility for possible losses, as markets can be volatile and unpredictable, leading to constantly changing opinions or forecasts.


