Note: We have a 4th of July special offer running from today until the end of this week (7th July). All people who sign up for a Paid Membership during this period can request us for a Cycles Forecast chart for any asset of their choice (any US or international stocks, commodities or cryptos). We do not believe in doing price discounts, but rather believe in adding more value whenever we can. If you join us as a Founding Member, then you’ll have the ability to request these type of charts (Cycles Forecast and technical charts) on a regular basis. Our Founding Members are also in for a surprise in the month of July!
Oil has had quite a rally recently, while Natural Gas has been on a decline and Uranium has been trying to find a footing. Let’s dive into these 3 assets to figure out what’s going on.
Oil And Natural Gas Technical Picture
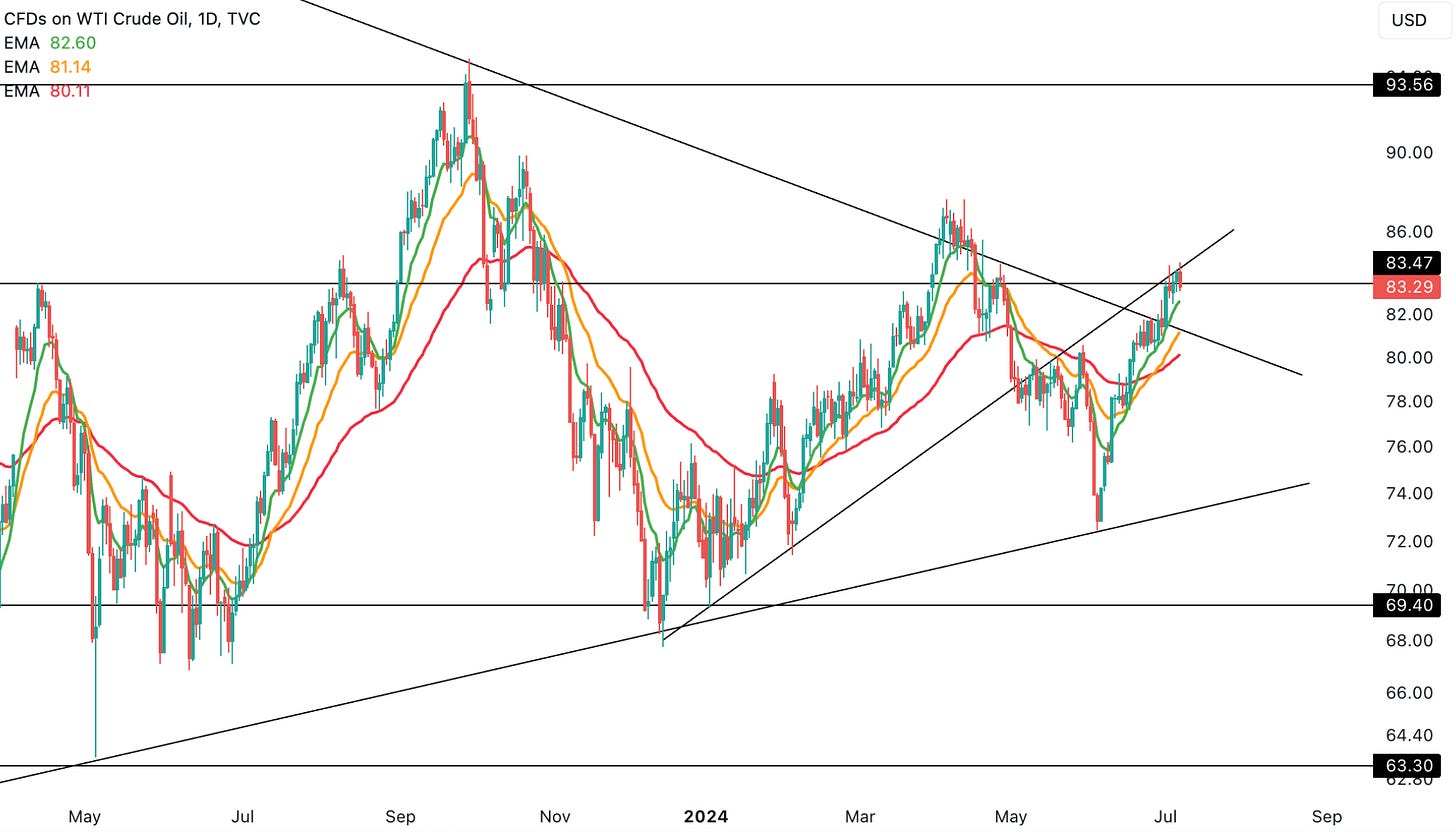
In our last Oil article (found here), we had mentioned that those wanting to buy Oil back then could do so at that time because price had just tagged the contracting triangle support. This support did end up holding and being the starting point of the recent run-up. Now, Oil has broken out of the contracting triangle resistance as well, surpassing the $80 trade target we had highlighted in the last Oil article. Is Oil breaking out? We’ll have to wait a little long in order to avoid getting faked out, like it did back in April.
There are a couple of short-term headwinds though. First is the resistance level at $83.47. Second is the uptrend support line that price broke down from in May and that line is now acting as resistance. A pullback here is more likely than a break of these 2 resistance levels that are around the same region.
The key question is if the pullback ends up retesting the major downtrend line (in the above chart) and converting that into support or if it ends up closing back under it resulting in a fakeout. We’ll have to wait and watch, but right now the risk-reward isn’t too attractive for Oil in either direction, so we’re waiting on the sidelines.
Natural Gas has seen quite a bit of selling in recent weeks following a daily bearish RSI divergence. The key level of support we’re eyeing is $2.125. A move under that to retest the downtrend line and convert it into support is acceptable, but a break below the downward sloping line is not. Until price comes to support, it doesn’t make sense to make any moves on this asset.
Uranium Technical Picture
Uranium, on the other hand, has finally hit its parabola and showed a good bullish response off of it. This parabola region also had confluence of the $26.12 support level, which increases the probability of this region holding.
The recent move up came from a daily bullish RSI and MACD divergence, indicating underlying strength that has been building. Price has also reclaimed the 9 and 21-daily EMAs, along with a bullish MACD. Moreover, price seems to be forming a double bottom, which will be confirmed with a break above $28.25 and has a target of $31.75.
Uranium Fundamentals
US is the largest global nuclear energy producer. Recently, Biden prohibited imports of Russian Uranium, which should be a further tailwind for the Uranium price in an already tight market. US consumes a significant amount of uranium annually, primarily for nuclear power generation. In 2023, the total uranium consumption by U.S. civilian nuclear reactors was approximately 51.6 million pounds of U₃O₈ (uranium oxide) equivalent.
In contrast, the domestic production of uranium in the United States is relatively low. For example, in the first quarter of 2024, U.S. production of uranium concentrate was about 82,533 pounds of U₃O₈. Over the course of 2023, the total annual production was only 50,000 pounds of U₃O₈. This disparity between consumption and production means that the U.S. relies heavily on imports to meet its uranium needs.
Major suppliers include Canada, Australia, Kazakhstan, and Russia. However, with Russia out of the equation, US now must turn to the other 3. Remember, Kazakhstan’s Kazatomprom (largest Uranium producer) is already having a hard time meeting their production numbers. So, this move by Biden has only made us more bullish on Uranium.
In the next section for our Paid Members, we’re going to take a look at a couple of important intermarket relationship charts for Oil to get a better sense of the validity of its move. We’ll then cover our proprietary Cycles Forecast for Oil and Natural Gas to understand the directional bias for the month of July. Then we’ll shift our focus to Uranium Miners ($URNM) and Junior Uranium Miners ($URNJ). Lastly, we’ll cover 4 key individual Uranium stocks - $NXE, $DNN, $UEC and $UROY.
NOTE: Our Q3 2024 Cycle Forecasts is now available for sale on cyclesedge.com. We are covering multiple different Indexes, Sectors, Commodities, Cryptos and Leading Stocks using our proprietary Cycles Forecast. Founding Members have already been emailed ALL the Q3 2024 Cycles Forecast. This is one of the many benefits of being a Founding Member, so consider upgrading your membership. In case any of our Founding Members have not received the full Q3 2024 Cycles Forecast set, please reach out to us via email or Substack message. We also have another surprise in the works for our Founding Members, which will be released later in July.


