What we saw in the stock market last week is known as a “rip your face off” or “face-ripping” rally. These occur when everyone thinks a crash will happen and retail traders short the market heavily by buying puts. The market makers who control prices, do not want to pay the retail trader, so they push prices in the other direction. As retail traders are caught wrong-footed, they close their short positions creating a “short squeeze”. This is the epitome of the max pain concept…whatever everyone thinks…the market will do the opposite! This time around it was the fear of increasing interest rates, geopolitical uncertainty, and a re-steepening yield curve which is known to be the precursor of an economic recession. Whatever it is, the market is happy to use the narrative to take your money.
If you like to make money in the market, you should learn to identify and love face-ripping rallies. The charts above and below show the Retail-Only Put/Call Ratio. In the chart above we can see that May to July rally of 2023 was a short-squeeze face-ripping rally as retail traders prepared for a new leg down by buying puts…and that’s when we get the best rally of the year. It appears we are set up for another run as retail is positioned very short once again, as prices pop higher.
The chart below shows that the best rallies tend to be kicked off by short-squeeze face-ripping rallies. The rallies after the Christmas 2018 drop and the 2020 Covid panic were both face rippers. The key is to remember that when everyone is positioned one way and there is a general consensus, the market will profit off of those positions by going the other way.
Right now we have a face-ripping rally during a bullish seasonal time. This is occurring when our cycles are pointing higher. The cycle forecast below is taken from our post from last week:
We could be on the verge of the elusive Swing Trader’s Market!
Swing Trader’s Market?
The Swing Trader’s Market is the rising tide that floats all (or many) boats. It’s the type of market that the best traders wait for to make money. After a 3-month pullback, I believe we are on the verge of a new Swing Trader’s Market.
Looking at the chart below, the S&P 500 is now above the 21 EMA and all of the other moving averages, which is bullish. There is a bullish MACD crossover and on Friday there were net new highs. As more stocks make new highs vs. new lows, a “float” occurs in the market where stock prices have a tendency to rise. The McClellan Oscillator spiked higher as did the Percent of S&P 500 stocks above the 20 simple moving average (MMTW). This all occurred as the VIX dropped below the 20 mark, enticing traders to hold positions overnight. If the SPY can break out of the declining channel, there is a good chance that the Swing Trader’s Market will occur.
There are Intermarket signs that this rally could continue into a multi-month rally. First of all, the rally was caused by a drop in the 10-year Treasury Rate (TNX), which has a tendency to reflate valuations (upward pressure on equities). TNX dropped after the FOMC decision on Wednesday to keep rates unchanged, making some investors bet that the Fed hiking cycle is over. There was also a drop in the US Dollar (DXY), which hints that money is flowing back into investments. Finally, the VIX rolled over, indicating that fear is fading and higher prices are likely.
Looking at sector rotation, the up week in the SPY was driven by interest rate-sensitive sectors (real estate and financials) and offensive sectors (consumer cyclicals, technology, communications). When offensive sectors lead, it supports the thesis for a strong rally.
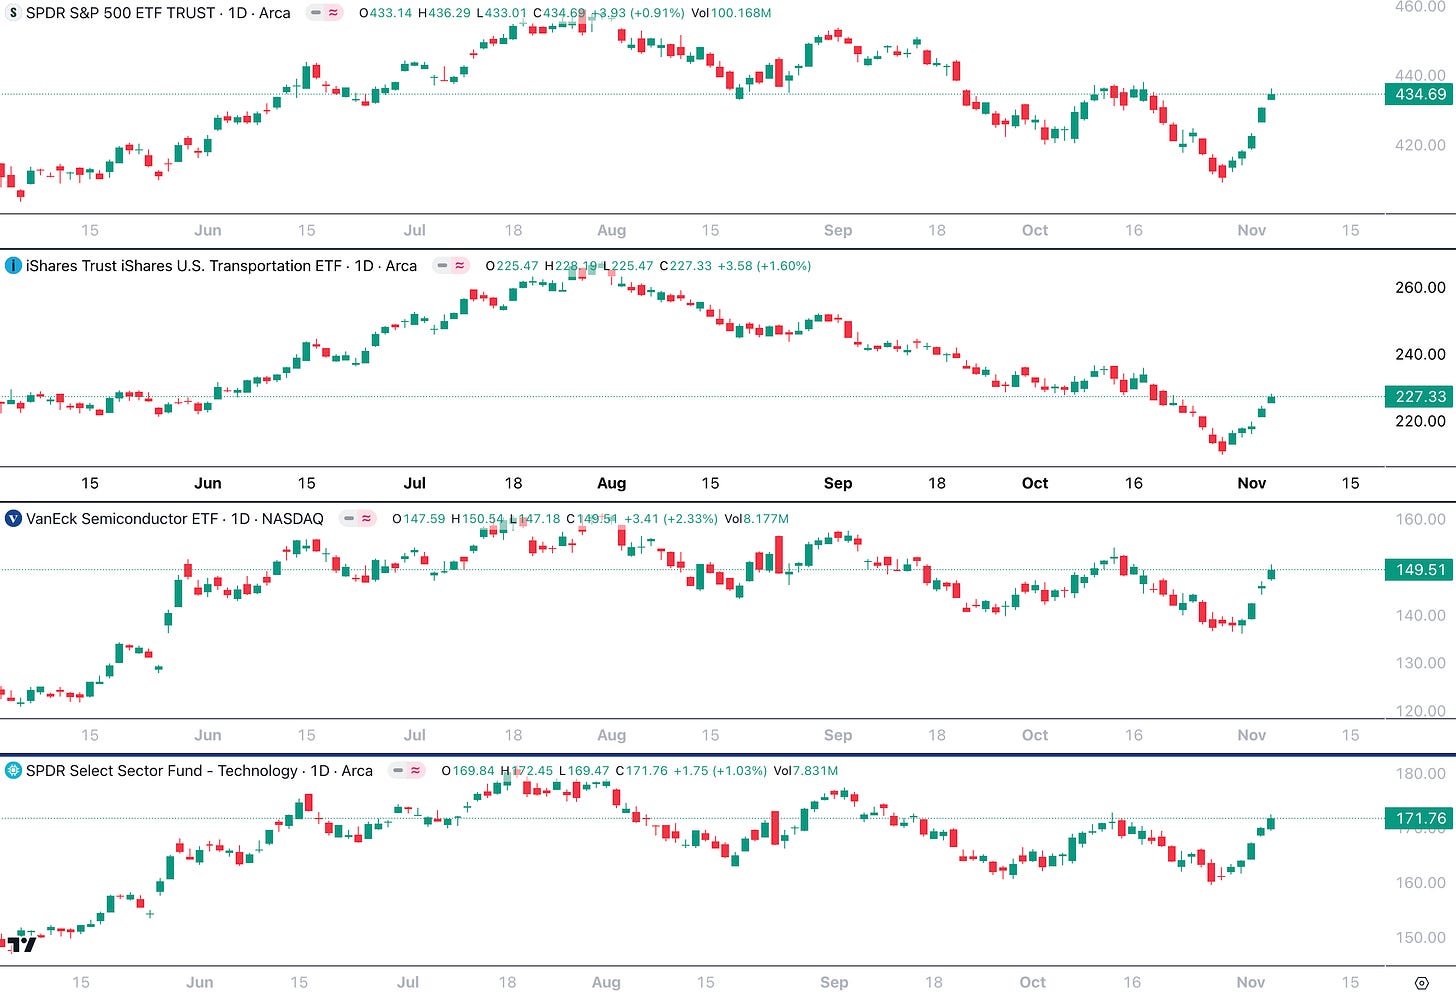
According to Dow Theory, when transports rise, it confirms the uptrend. This is still an excellent barometer of stock market strength, but in today’s technology-driven world, semiconductors and tech could also be used to confirm strength. The chart below shows strength in transports (IYT), semiconductors (SMH), and technology (XLK).
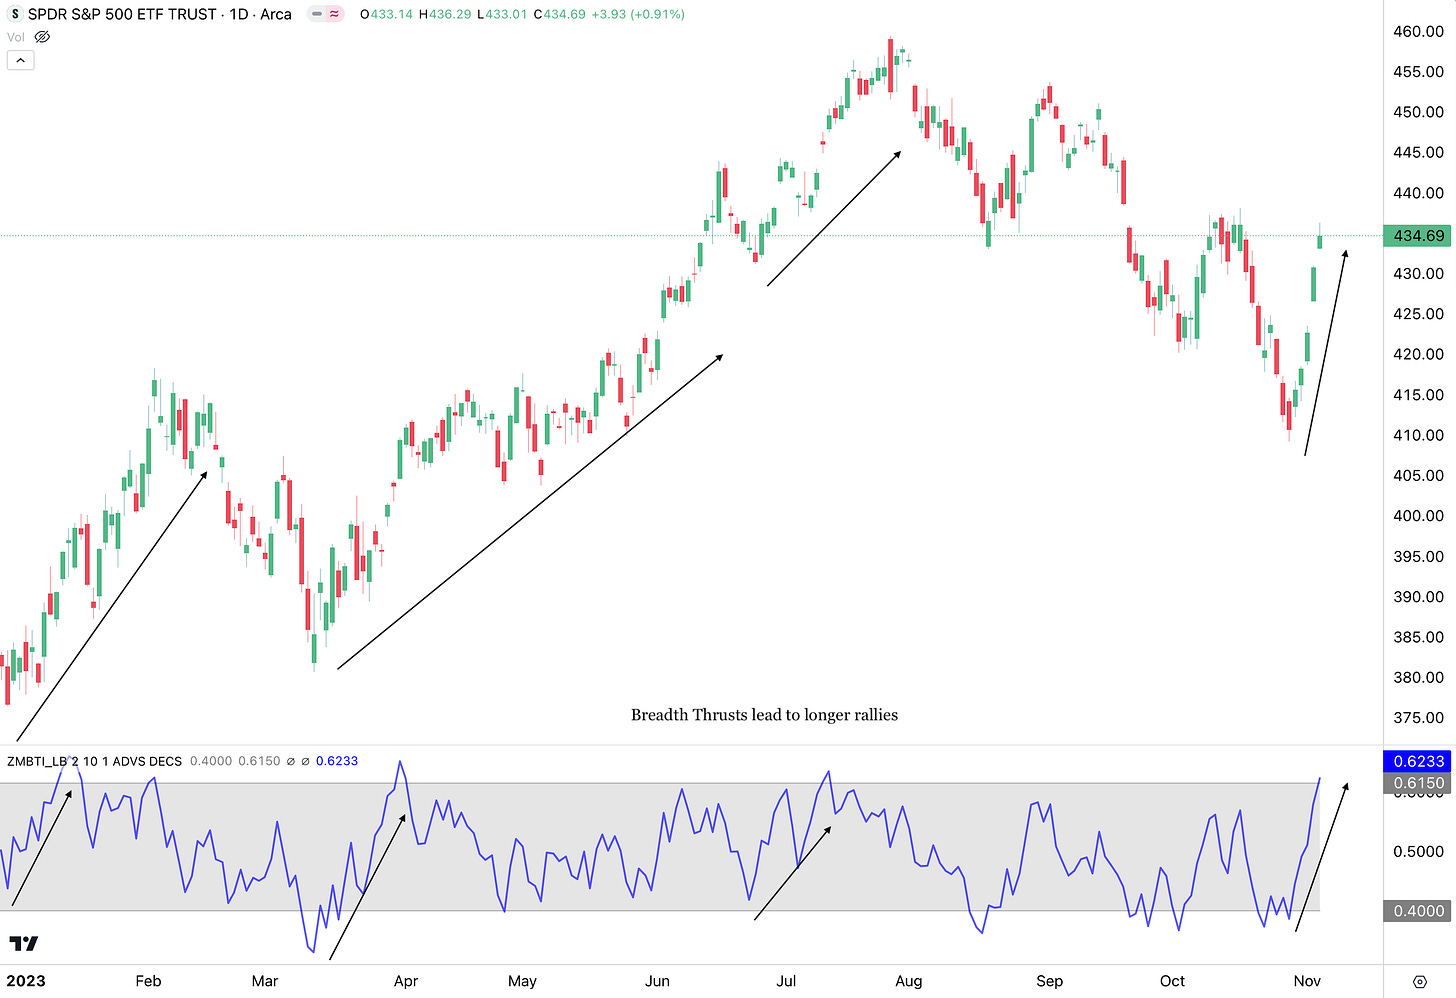
The market had a Breath Thrust last week and according to Marty Zweig, when the 10-day Exponential Moving Average (EMA) of the Advance Decline Line (NYSE Advancing Issues /NYSE Total Issues) moves from a level below 0.40 (40%) to a level above 0.615 (61.5%) within a 10-day period it creates a buy signal that often precludes new bull markets. In today’s choppy market, a multi-month uptrend is sufficient. You can see from the chart below that Breadth Thrusts did lead to tradable rallies.
Finally the Bullish Percent of Index S&P 500 stocks showed huge breadth participation. This strong show of demand for stocks is more indicative of a change of trend than a countertrend rally in a downtrend and could represent funds buying beaten down stocks on the cheap after the end of the mutual fund tax loss harvesting deadline (October 31).
Too Hot Too Fast?
Hold on…not so fast. The MACD is still below the 0 mark and sustainable Swing Trader’s Markets typically have a MACD above 0. Also, the market spiked almost 7% last week, which could put the market near short-term overbought levels. The market could continue higher for a few more days, but a pullback is likely over the next two weeks. The McClellan Oscillator, a breadth oscillator, appears overbought already. When this occurs, the market usually consolidates or pulls back.
The advance stopped right at the Anchored Volume Weighted Average Price (think of it as a volume-based moving average) from the July high. Price may have a hard time breaking this resistance point and powering onwards. A pullback to the 38% Fibonacci Retracement at $426 or the 50% Fibonacci Retracement at $423 is possible. These levels have confluence with the 20 SMA and 200 SMA respectively.
There is also the “Magic 8” trick, which shows that the SPY always retests the 8 Exponential Moving Average. When SPY is extended from the 8 EMA, it usually finds a way to retouch the 8 EMA, either by pullback or sideways consolidation. Looking at the chart below, you can see that when the SPY has a distance of $8 or $9 from the 8 EMA, it finds a way back to retest it. It could continue higher first, as the Slow Stochastics and RSI oscillation indicators are not oversold yet, albeit they are getting there. If the SPY retests the 8 EMA, it would retrace to the $425 level, close to the 38% Fibonacci Retracement.
Seasonality:
According to the Stock Trader’s Almanac, the month of November tends to be strong for the first 4 trading days of the month (until 11/6)…encounter some mid month chop…and then close with the Thanksgiving rally beginning around the 15th (11/21) to 17th (11/24) trading day of the month.
Cycles:
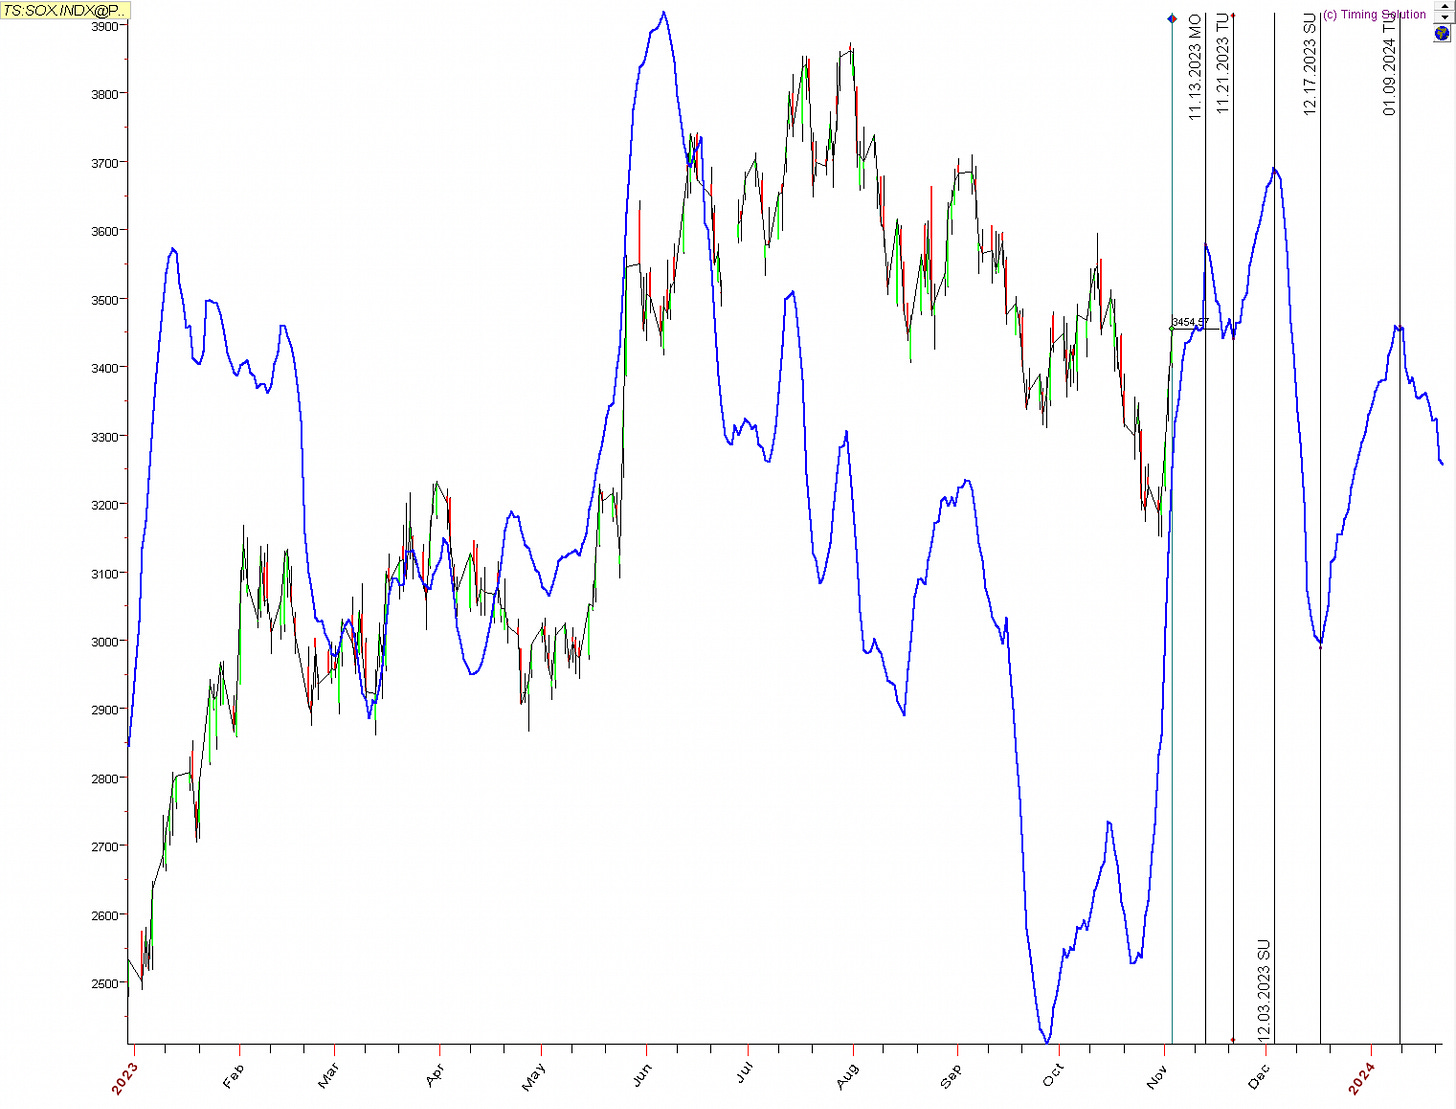
Supporting the thesis of a year-end rally is the cycle forecast of a falling 10-year Treasury Rate. If the cycles play out exactly, there could be a bit of choppiness for the 10-year Treasury Rate from now until year-end.
XLK (technology) and the Semiconductors Index (SOX)are poised for a strong November, however as interest rates tick up between 11/20 to 12/13, there could be some profit-taking starting 12/3. They both bounce back for a Christmas rally from 12/18 to the beginning of January 2024, but the cycle forecasts seem less strong.
The transports (DJT) also seem susceptible to a 12/4 profit-taking but still bounce back for a Christmas rally.
Conclusion:
Based on our analysis, it’s possible that we pull back or consolidate into support over the next two weeks. There could be a strong Thanksgiving rally starting around 11/18 to 11/23. Please practice risk management and if you take positions, make sure to have a risk management plan that fits your risk tolerance.
Disclaimer - All materials, information, and ideas from Cycles Edge are for educational purposes only and should not be considered Financial Advice. This blog may document actions done by the owners/writers of this blog, thus it should be assumed that positions are likely taken. If this is an issue, please discontinue reading. Cycles Edge takes no responsibility for possible losses, as markets can be volatile and unpredictable, leading to constantly changing opinions or forecasts.


