Bitcoin sentiment has really been beaten down lately. 5 months of sideways consolidation has caused a lot of investors to throw in the towel. A lot of times, price capitulation is easier to deal with because in causes quick but short-lasting pain. On the other hand, time capitulation with boring price action really tests an investor’s patience and washes out speculative hands. This is especially true with other markets (like S&P 500 and Nasdaq 100) are hitting new highs in the last 5 months. Now, only the strong hands and those who can see the opportunity past the short-term volatility remain.
Bitcoin Technical Analysis
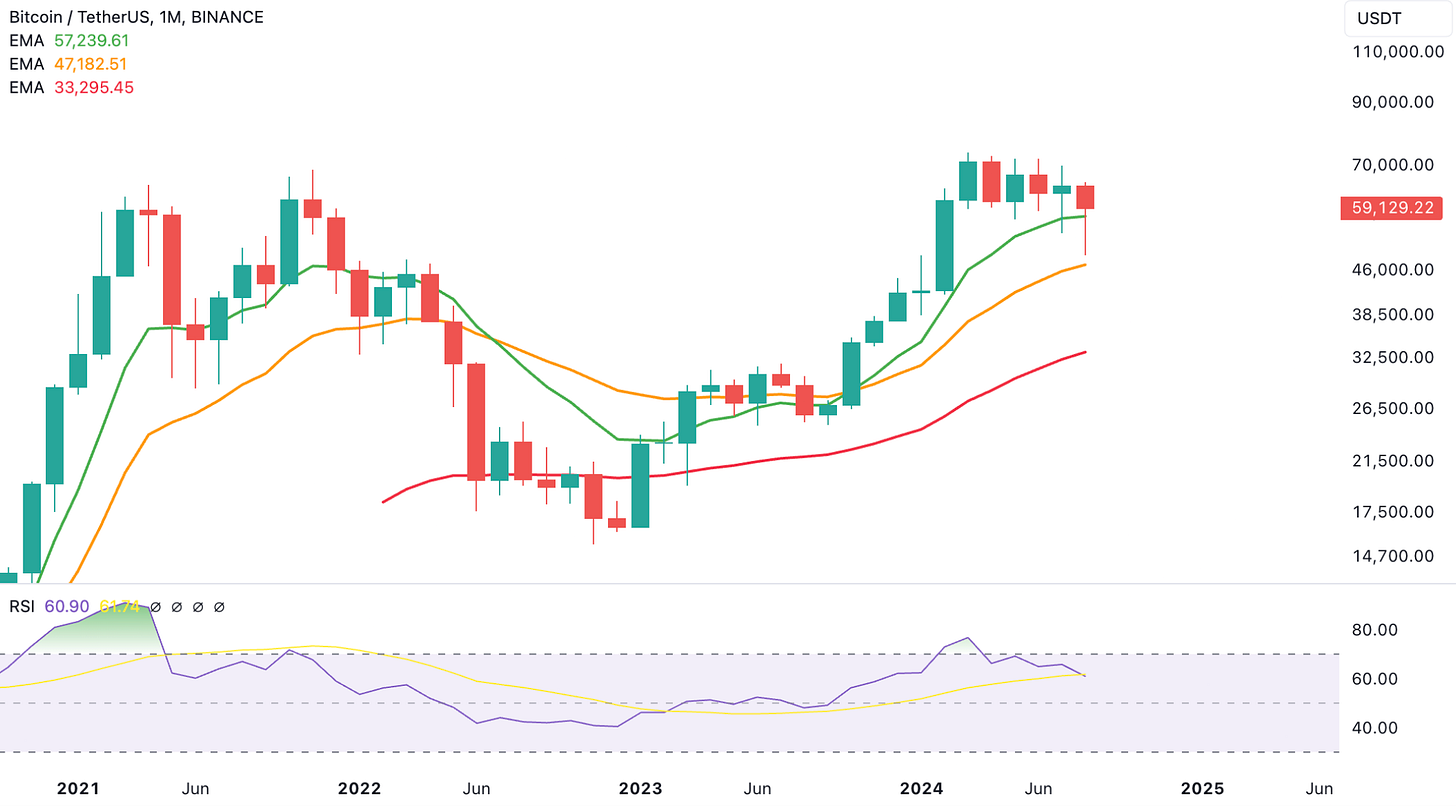
Bitcoin just had its August monthly candle close. The good news is that the 9-EMA on the monthly was held on a closing basis, despite the sharp drawdown in the beginning of last month.
The bad news is that price is very likely to test the monthly 9-EMA again in September and it is pretty important to hold this level (around $57,300) on a monthly closing basis to avoid opening the door for a deeper pullback to the monthly 21-EMA (around $48,100).
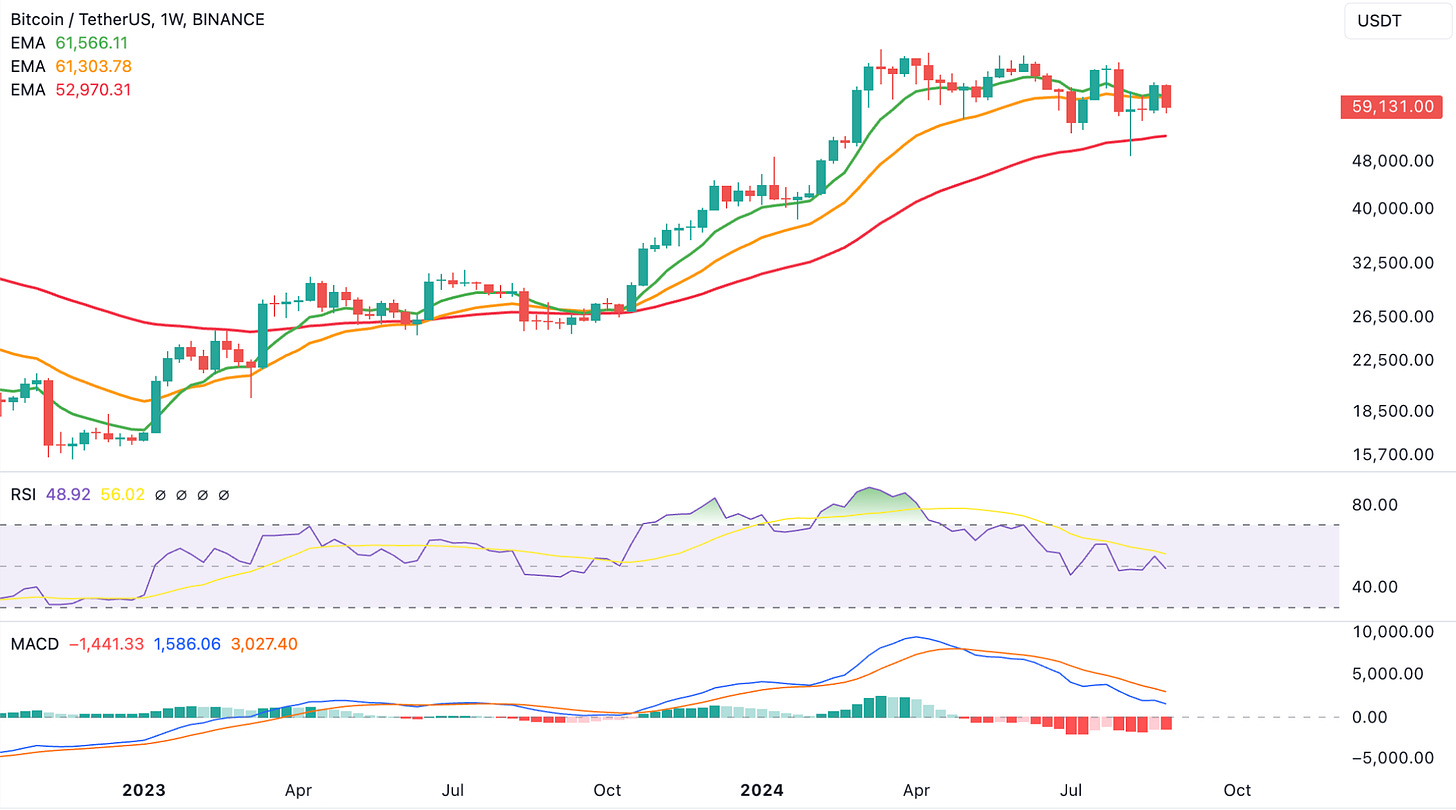
Objectively speaking, the weekly chart doesn’t look too compelling for now. The weekly candle is breaking below the 9 and 21-EMAs, which does put a potential move to the 55-EMA ($52.9k) on the table – an attractive buying opportunity. Therefore, the upcoming week will be a key one and if price can reclaim the $61.3k level (weekly 9 and 21-EMA) on a weekly closing basis, then the risk of further downside reduces significantly.
Ethereum Technical Analysis
Ethereum has already broken below its weekly 55-EMA and recently rejected off it as well. Such a move typically leads to more downside first. The areas of interest are the uptrend line (around $2170) and the support line at $2109. The downside pressure would significantly reduce once price is able to have a weekly close above $2620, which would also reclaim the weekly 9 and 21-EMA.
If Ethereum does end up pulling back around the $2109 to $2170, then it’ll end up filling its 5th August downside wick and likely form a daily bullish RSI divergence. This is a scenario that we highlighted in our 12th August Crypto Piece (found here) and is still very much possible today.
Speculation Index
The beaten down sentiment is clearly evident in the Speculation Index (courtesy of Capriole). This metric shows the percentage of altcoins with 90-day returns greater than Bitcoin. High readings suggest speculation. Lower readings suggest capitulation, and potentially greater investment opportunities in altcoins. The current reading of 10% is quite depressed and has historically proven to be an extremely rewarding zone.
The Premium Section has a lot of important charts for our Paid Members. We’ll cover:
1) September Cycle Forecasts for Bitcoin and Ethereum
2) Ethereum to Bitcoin ratio
3) Reason for the current Crypto market decline
4) Global liquidity – A key Macro factor
5) Proof that the Bitcoin cycle top is NOT in
6) Statistical data on all the past September’s for Bitcoin
Cycle Forecasts – Bitcoin


