Trade Setup: Buy the S&P 500 for the Spring Rally
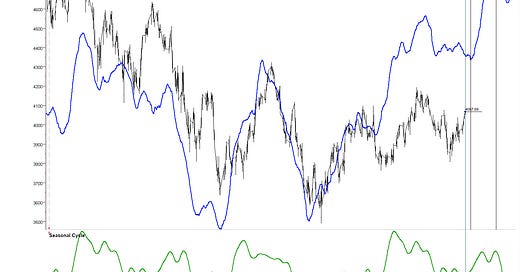
Cycles & Seasonality: The Cycle Composite points to a Spring Rally that begins around April 6th. This year the Easter Bunny may have started early as the market seems like it’s off to a head start. According to the Cycle Composite, the Spring Rally should last until May 6th before retracing a bit. The Seasonal Cycle is also supportive during this time period.
Sentiment: The Fear & Greed Model points to a bullish reversal, as the indicator started to move towards the greed side. This is very telling as fear stopped increasing in the face of what many thought could be a new financial crisis.
1 Source: Sentimentrader.com
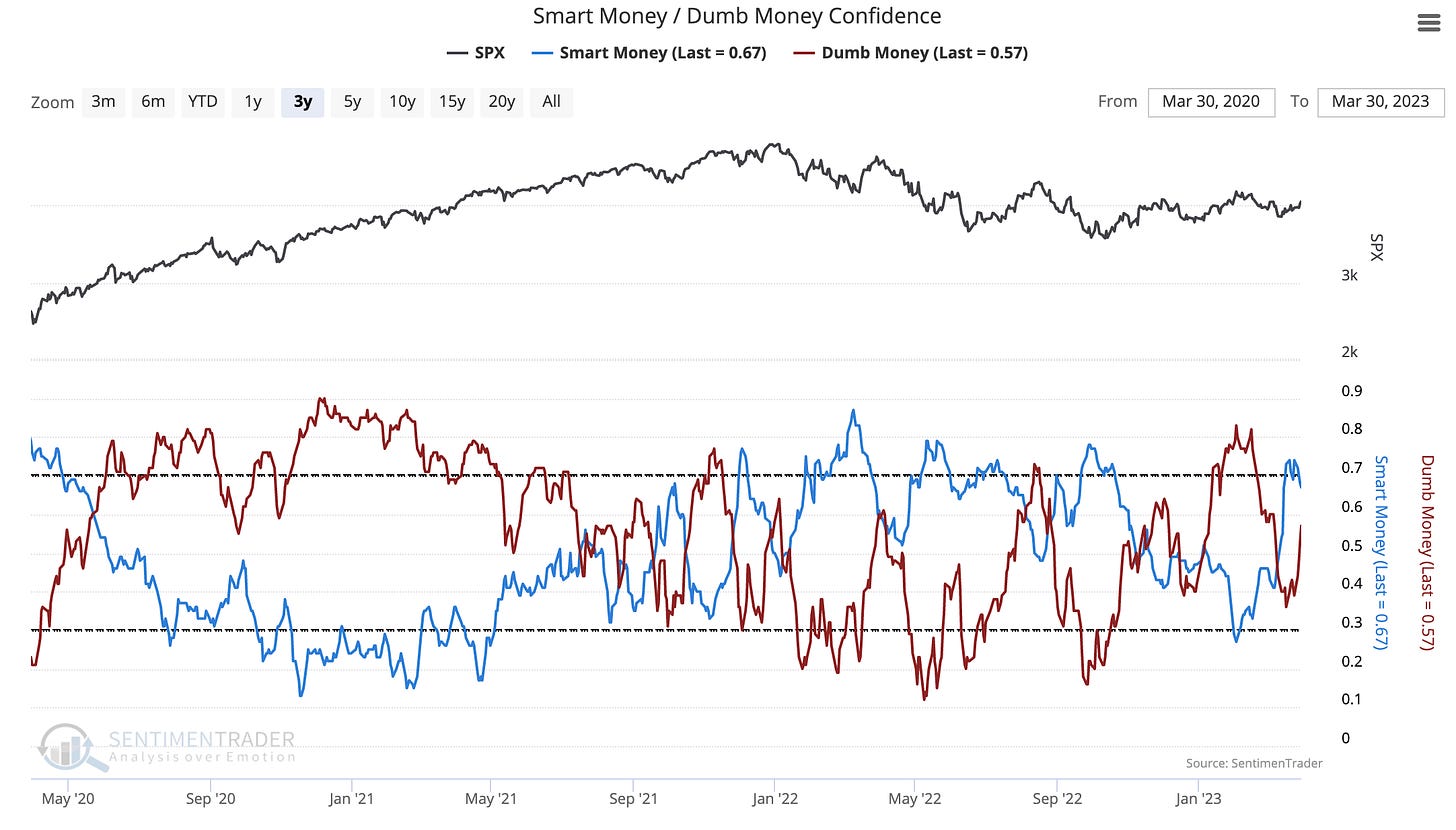
Perhaps it was Smart Money buying that stabilized the market (blue line below). As Dumb Money piles back into the market, prices usually rise, which is just in time (perhaps a tad early) for the Spring Rally.
2 Source: Sentimentrader.com
Volatility: The VIX and the MOVE Index (volatility index for bonds) fell into hard downtrends and are both below the 20-day moving average. After all the fearful headlines of a new banking crisis, it’s as if the market is saying “whatever, that’s yesterday’s news”. A VIX below 20 is very supportive of a rally. The MOVE Index may be signaling that the systemic banking risk is contained.
Breadth & Volume: The NYSE McClellan Summation Index ($NYSI) just started an uptrend as the Parabolic SAR indicator (blue dots) flipped. The $NYSI is a slower-moving indicator but does well to confirm the trend. Trends on this indicator tend to be multi-week, providing support that we are beginning a new uptrend.
The NYSE Volume McClellan Summation Index (!VMCSUMNYA)similarly started an uptrend. Breadth and volume internals are supportive at the moment.
Technical Setup: On the daily chart the price of SPY got above the 20-day moving average and the Ichimoku Cloud, telling us that it’s in an uptrend. It even broke above the downtrend line from February. The CCI indicator got above 0, hinting that the uptrend has only just begun. The Money Flow Indicator displays how money is buying into SPY. There are pivot points at $412 and $417, so profit-takers could come in at those levels. However, with the positive sentiment and positive breadth, it’s possible that this uptrend could last until May or beyond.
On the weekly chart, the price of SPY is in the Ichimoku Cloud. The fact that price did not get rejected and drop at the cloud hints that there is underlying strength in the market right now. The upper projection band (purple band) is at $425, which could be a reasonable target for the Spring rally. If strength continues, perhaps SPY could get to the $454 or $485 pivot points, however, I believe that is a low probability as that would push the P/E ratio to 20.99x and 22.42x respectively. Valuation levels of that sort during a non-Dovish Fed policy regime are unlikely.
Valuation: Looking at the valuation chart below you could see that the SPY usually trades between the 15x to 19.65x P/E ratios. If the market rallies to the 19.65x P/E Ratio it would imply a price target of $425.
3 Source: Fastgraphs.com
Risk Management: I believe that we will have a tradeable and profitable Spring rally. All investors should manage their own risk, but here are some ideas:
Buy and Hold investors could allocate money now and look to add more on future cycle low points.
Swing traders could buy and set a stop-loss order under the 20-day moving average under $395.
Option buyers could buy call options on or past the May 5th expiry.
Option sellers could sell put options 5 days out to collect weekly cash flow.
Disclaimer: This post is for educational purposes only and is not official financial advice. For financial advice please consult your Financial Advisor. I have laid out ideas on how I trade my own money and I do have positions. Please manage your own risk accordingly. This blog assumes no responsibility for any possible losses.


