

Wyckoff Distribution - Educational Piece
What To Look For?

Announcement: Our 1Q 2025 Cycle Forecasts are now available on cyclesedge.com.
Full-year 2025 Cycle Forecasts for our 13 main asset classes (SPY, QQQ, IWM, DIA, VIX, TLT, LQD, HYG, US Dollar, Oil, Gold, Silver, and Bitcoin) and 1Q 2025 Cycle Forecasts have been emailed to all our Founding members and are also posted in our Discord on December 20th.
You can buy the 1Q 2025 Cycle Forecasts on cyclesedge.com, but the Full-year 2025 Cycle Forecasts is ONLY available for our Founding Members. Consider becoming a Founding Member to receive both the Forecasts.
Wyckoff Accumulation/Distribution, named after Richard Wyckoff, is a method used in technical analysis to identify potential Accumulation or Distribution phases in the price of an asset/stock. Typically, the moves that comes out Wyckoff Accumulation or Distribution are very big in size, so being on the right side is often extremely profitable.
During accumulation, smart money quietly buys the asset at lower prices, leading to a sideways or slightly downward price movement.
Conversely, during distribution, smart money sells their holdings to the public at higher prices, leading to a sideways or slightly upward price movement.
Traders use Wyckoff analysis to detect these phases and make trading decisions based on them. The best part is that Wyckoff Accumulation/Distribution is a common pattern seen across different asset classes, so learning this can very useful irrespective of the stock/asset that one trades/invests in.
There are 2 types of Accumulation patterns and 2 types of Distribution patterns. We already covered Wyckoff Accumulation here. This Educational Piece covers the 2 types of Wyckoff Distribution patterns. The previous Educational Piece titled “Wyckoff Accumulation – Educational Piece” found covered the 2 types of Accumulation patterns.
Wyckoff Distribution Pattern 1

Wyckoff Distribution pattern 1 is similar to the Wyckoff Accumulation pattern 1 but exactly opposite to it. For those using Tradingview, if you find Wyckoff Accumulation easier to identity then you can “Invert Scale” the chart under settings and look for the Wyckoff Accumulation pattern (which would technically be a Wyckoff Distribution since the chart is inverted).
PSY - Preliminary Supply, where large players begin to unload shares in quantity after a big up-move. Volume expands and price spread widens, signaling that a change in trend may be approaching.
BC - Buying Climax, during which there are often marked increases in volume and price spread. The force of buying reaches a climax, with heavy or urgent buying (FOMO – Fear Of Missing Out) by the public being filled by professional players at prices near a top. A Buying Climax often coincides with a great earnings report or other good news, since the large players require huge demand from the public to sell their shares without plummeting the asset price immediately.
AR - Automatic Reaction, with intense buying substantially diminished after the Buying Climax and heavy supply continuing, an Automatic Reaction takes place. The low of this sell-off helps define the lower boundary of the distribution Trading Range.
ST - Secondary Test, in which price revisits the area of the Buying Climax to test the demand/supply balance at these price levels. For a top to be confirmed, supply must outweigh demand. A Secondary Test may take the form of an UpThrust (UT), in which price moves above the horizontal resistance formed by the Buying Climax before quickly reversing to close below resistance. This is typically to take out the late shorts whose stop losses are right above the Buying Climax price level. After a UpThrust, price often tests the lower boundary of the Trading Range.
SOW - Sign Of Weakness, observable as a down-move to (or slightly past) the lower boundary of the Trading Range, usually occurring on increased spread and volume. The Automatic Reaction and the Sign Of Weakness indicate a change of character in the price action of the asset. Supply is now dominant.
UTAD - UpThrust After Distribution. A UTAD is the distributional counterpart to the spring (Wyckoff Accumulation pattern 1). It occurs in the latter stages of the Trading Range and provides a definitive test of new demand after a break above the Trading Range resistance. This typically triggers the stop losses for shorts and tricks people into believing that a continuation of the uptrend is occurring. However, UTAD losses steam very quickly and closes back within the Trading Range forming a deviation/fakeout.
LPSY - Last Point of Supply. After testing resistance (and briefly surpassing it) on a UTAD, price starts to consistently decline showing that the market is having considerable difficulty finding support or advancing. This inability to rally may be due to weak demand, substantial supply, or both. LPSYs represent exhaustion of demand and the last waves of distribution before the Trading Range low gets taken out and a markdown occurs.
Example

A Wyckoff Distribution pattern 1 was seen during Cardano ($ADA) top in 2021. Notice how in Phase C, the “UTAD” takes out the Trading Range/UpThrust highs, but goes onto quickly close within the Trading Range. This helps smart money catch retail off-guard and trigger the stop-losses for leverage positions that have their stops right above the highs of the Trading Range.
In the next section, we’ll cover Wyckoff Distribution pattern 2 with examples.
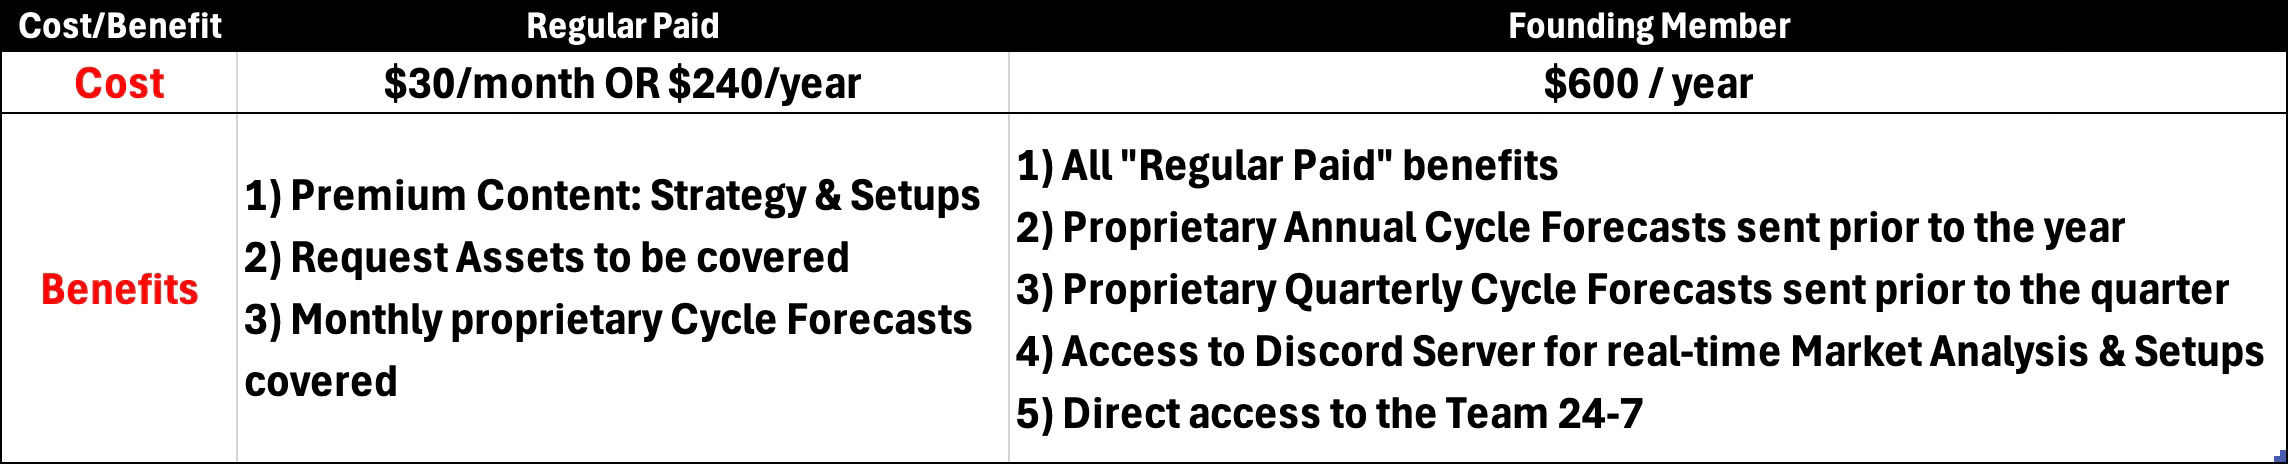
Find our membership cost/benefits below. If you’re serious about Making Money (our primary goal at Cycles Edge), then the Premium Sections are key for you!