The market continues to go up in a lockout rally fashion and after some sideways consolidation, the S&P 500 is now retesting 2023 highs. This meltup price action often occurs after a Zweig Breadth Thrust, which occurred in early November.
Last week our analysis pointed to a rotation out of the Magnificent 7 and Large Cap Growth stocks and into other areas of the market, namely Mid-Caps, Value, Materials, and Real Estate. This is currently playing out and you could read that piece here.
This week we’ll analyze the market from the perspective of FUEL. What causes markets to move with Money-Making momentum? Cycles determine the direction, but not the degree of a move. These three fuel types do determine the degree:
Fuel #1 Macro Fuel: Interest rates, Inflation, and GDP Growth rates affect the population of countries and have the largest impact on markets because they affect the daily lives of people. Macro guides money flowing from the pockets of people to the coffers of companies. It also affects the use of “other people’s money” through loans, which has a leverage effect on the economy. We find that changes in interest rates and inflation (which drives interest rates) provide the most powerful fuel for the markets. This is covered in the Intermarket Analysis section.
Fuel #2 Fundamental Fuel: Revenue and earnings growth relative to valuation (price paid for said growth) affect stock prices, but this type of fuel tends to be company, industry, or sector-specific. Growth in the Total Addressable Market (TAM) for a product or service and sales growth (proof of a company’s ability to capture a TAM opportunity) tend to make explosive moves in stocks. On the other hand, overvalued stocks faced with slowing growth cause drops in stock prices just as quickly (often quicker). We find that the emergence of themes that change how the masses live (evidenced by sales growth) is quite a powerful fuel for the companies involved. This is covered in the Technical Analysis area.
Fuel #3 Trap Fuel: The stock market is a for-profit entity that makes money on transactions (stock, ETF, option, whatever). As such, prices oscillate from highs to lows and back again for the reason du jour (and the narrative always changes). Participants make trades, find themselves wrong-footed, lose money, and then exit or reverse positions. Fast moves come from false moves. This process repeats over and over again, and throughout the process the house (market makers) makes money. This is why the market tends to do the opposite of what most people believe…when people reposition themselves, it creates fees…and the market loves fees! We believe that understanding the positions of market makers, institutional money, and retail money provides a hint at future price action. This is covered in the Players Analysis section.
Now let’s analyze how these Fuel Concepts play out when we mix them with the concepts of Momentum, Cycles, and Seasonality.
Intermarket Analysis: Conditions Point to Smooth Sailing for Now
The stock market is rising on the narrative of a Fed Pivot, where the Federal Reserve Bank is expected to stop raising rates and begin dropping rates at some time next year. This is the most powerful form of Macro Fuel as lower interest rates boost stock valuations while helping many businesses that work with loans (real estate, auto, retail, etc.). The Fed Watch Tool below is now forecasting a 55% chance of a 25 basis point rate cut at the March 20, 2024 FOMC meeting. The fact that inflation has been falling provides credibility to this narrative, as interest rates are driven by inflation.
From an Intermarket Analysis perspective, we see blue skies and smooth sailing for now. The 10-year Treasury rate (TNX) is falling in a downtrend under the 21 EMA. Note that many Momentum Swing Traders use the 8-day EMA and 21-day EMA as evidence of momentum in trends and often trade based on these EMAs. The US Dollar (DXY) is also falling in a downtrend below the 21 EMA as money flows to risk assets like stocks, bonds, gold, and cryptocurrencies. Finally, Oil is also falling in a downtrend below the 21 EMA and this provides confidence that inflation will continue declining as oil is the most impactful component of inflation.
Let’s now use Cycles to see how long these conditions could remain.
For the S&P 500, our cycles all bottomed on 10/27, but the rally accelerated on 11/2 with the FOMC Rate Decision to leave rates unchanged. This shows how cycles could guide investors in the right direction, however, FUEL is required to bring momentum. After a strong Friday, the S&P 500 could spend some time in consolidation or have a small pullback (we will provide more details in the Technical Analysis section). Our Cycles Composite (blue forecast) and Energy Cycle (pink forecast) point to some downward pressure beginning 12/4 and the Seasonal Cycle (green cycle) tops around 12/8. In all cases, our cycles expect the Santa Clause rally to start around 12/13.
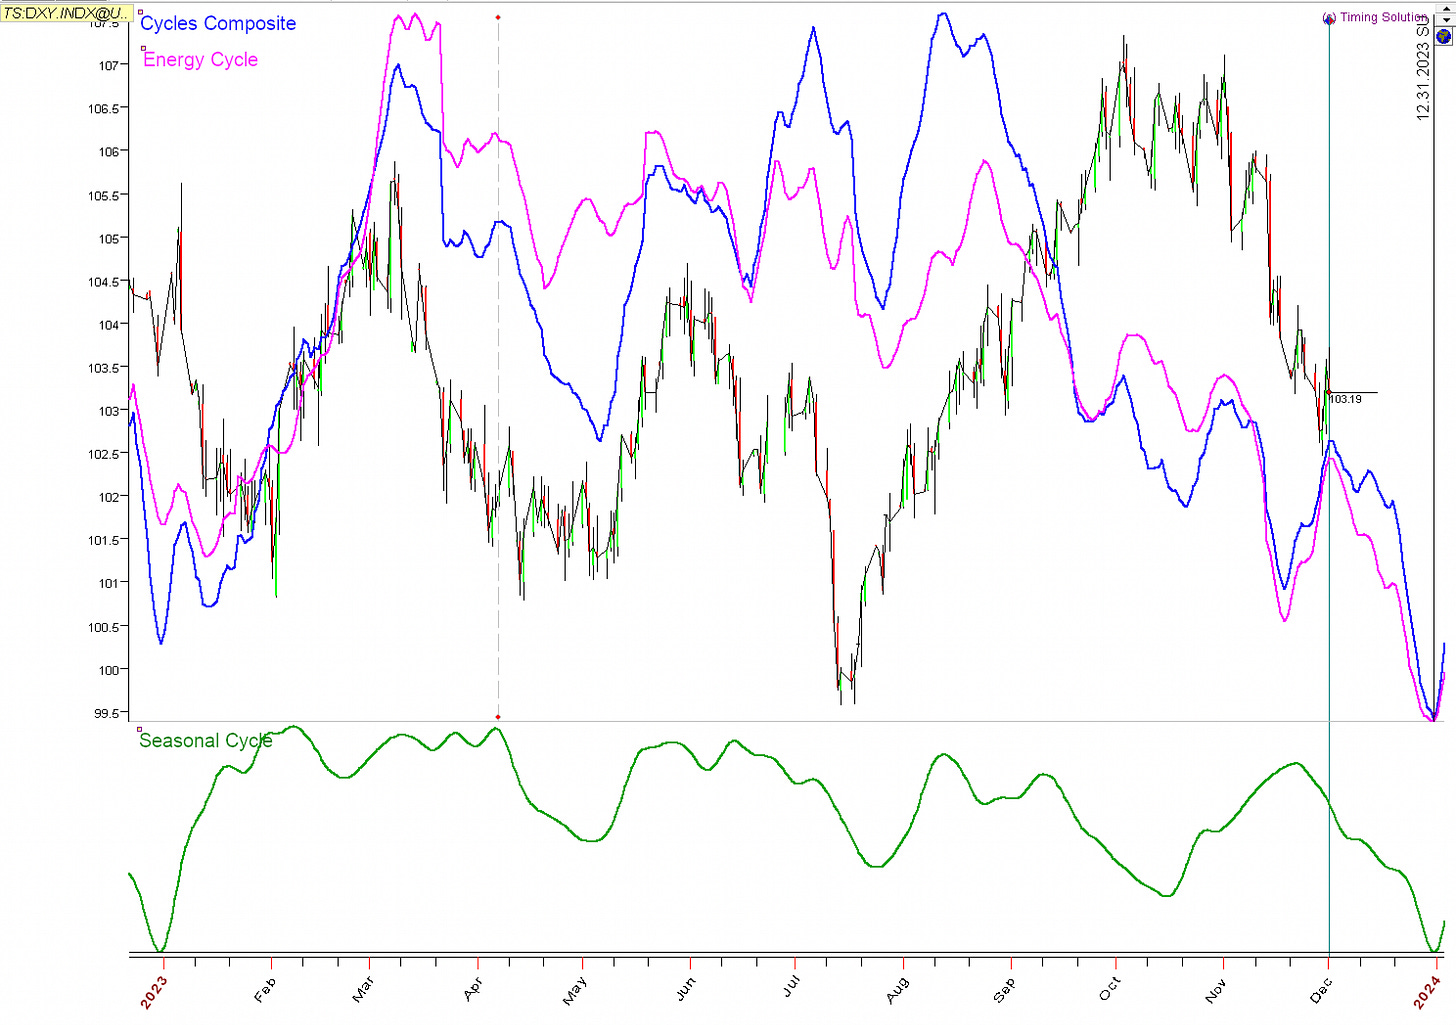
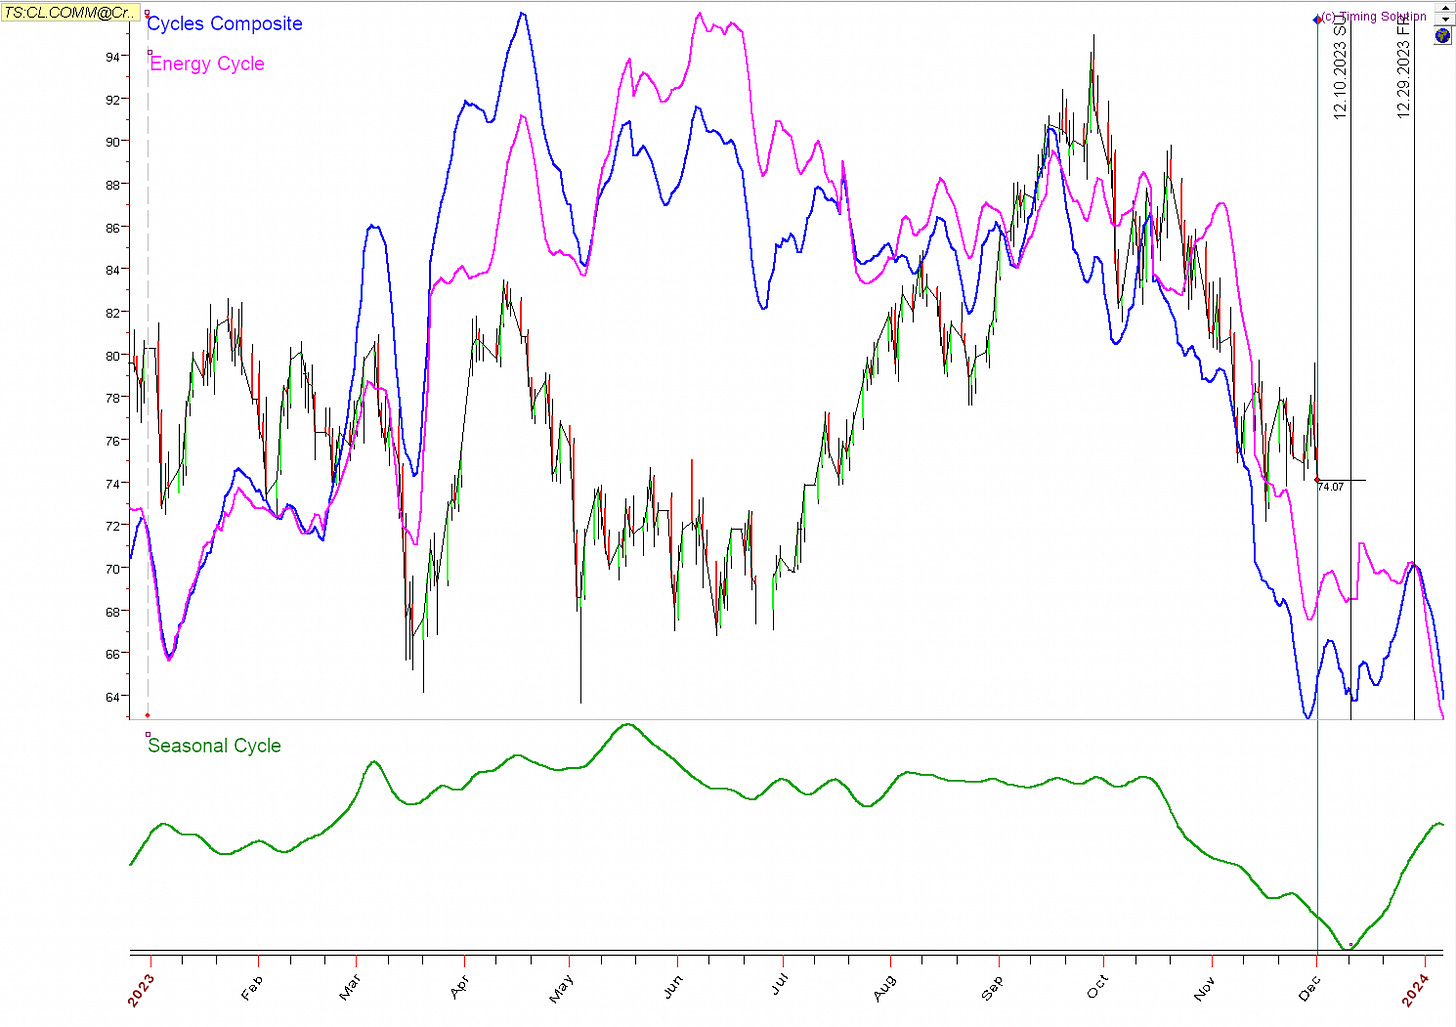
Looking at the 10-year Treasury Rate (TNX) our Cycles Composite points to lower rates until 12/29. Our Energy Cycle begins to perk up around 12/24. We believe that these two proprietary cycles are more powerful than the Seasonal Cycle which shows that there is a seasonal tendency for rates to drift a bit higher in December.
The US Dollar is forecasted (by all forecasts) to decline until 12/31.
Oil may experience some choppiness as the Cycles Composite and Energy Cycles appear to create a consolidation pattern, despite the Seasonal Cycle pointing at some upside. When cycles don’t confirm each other, choppy action often occurs. Again, we put more weight on our proprietary cycles and expect oil to ultimately head down into year-end.
Note that later this month we will begin providing quarterly cycle forecasts for Indexes, Sectors, Cryptocurrencies, Commodities, and Stocks.
Player Analysis: Chasing That Christmas Ham!
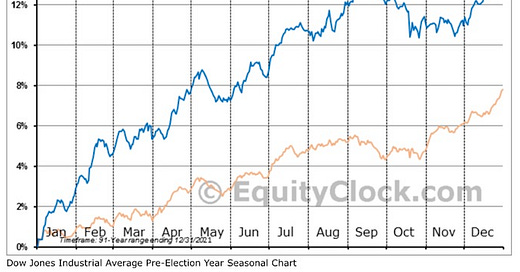
Why do we get Christmas rallies? Because Wall Street (mutual funds and hedge funds) often push the market up to close at a high “watermark” at year-end so that they get a bigger year-end bonus (I call that “Christmas Ham”). Moreover, funds “window-dress” and buy winning stocks that attract new money when prospective investors look at a fund’s holdings as of 12/31. This combination creates a bullish energy for the markets in December, especially in Pre-Election years, as evidenced by the seasonal chart below:
Smart Money who missed the November leg of the rally will be looking to make some money in December. Looking at the Smart Money/ Dumb Money Confidence indicator below, many funds were doubting the rally and have now begun to chase it to get that big year-end bonus. The odds are in their favor. We will cover what they are buying the the Rotations section later.
We believe that Market Makers will let the rally continue because Retail traders still own a lot of put options and if the market drops, the Market Makers will have to give their Christmas Ham to Retail. Don’t make me laugh…Big Bank Market Makers will never willingly pay Retail! You can see from the chart below that Retail puts are beginning to get washed out (closed out at losses or expire worthless), but there is still a way to go, and thus the rally has a way to go. This is a great example of Trap Fuel, where bearish positioning leads to bullish price action.
Financial Advisors and Professional Money Managers jumped on board and are now pretty heavily invested in equities, according to the NAAIM Exposure Index. We believe that this provided a “buy-the-close” dynamic in the markets during November and contributed to the melt-up price action in stocks. This was probably a good move for Advisors as clients will be happy after Friday’s market gains.
Although we believe that the rally will continue, we expect the rotation out of Large Growth/Large Tech to continue for a bit longer. You can see from the Commitment of Traders Report charts below that Market Makers (Dealer) amassed a significant short position making a market for Asset Managers, who bought heavily (probably to window dress). They don’t want to take a loss on this short position, thus they will probably attempt to keep the Nasdaq 100 at a relative weakness and attempt to exit their short position at lower prices. This supports the idea that other asset classes and sectors will lead the next leg of the rally.
Technical Analysis: In a Swing Trader’s Market Ride the 8 and 21 Train, Don’t Jump in Front of it!
The S&P 500 (SPY) continues to surf above the 8 EMA (pink line), even after a 7-trading day sideways consolidation. Within this period a bear trap was set as traders saw that the RSI and Stochastics oscillation indicators were overbought. I even received an email from Fidelity telling me to consider selling because the RSI indicator was overbought. Moreover, the % of Stocks Above the 20 Moving Average (MMTW) hit the 80 mark, a level that often brings reversals, and began to move lower. This trapped many traders who tried to call a top and short the market. When they realized that they were wrong, they covered their shorts and this became a mini-short squeeze that served as Trap Fuel to power the market higher on Friday. The short setup did not work because: 1) the Advance-Decline Line (breadth) was way too strong, 2) there was no fear in the market as the VIX drifted lower, 3) the Global Money Supply (black line below) was rising, 4) price was above the 8 and 21 EMAs, which are two powerful momentum trend indicators and 5) oscillation indicators (RSI, Stochastics) are less effective during momentum markets. To make money in the market you should ride the 8 and 21 EMAs, not bet against them.
Despite the strong move on Friday, the SPY hit resistance at the 7/27 high. If we get a pullback in the SPY, we see a confluence support zone between the Options Market Maker Move for 12/13 (our cycle forecast bottom) around $451 (green horizontal line), the 21 EMA around $447, and the $444 Fibonacci Pivot Point. SPY could drop to this zone (or possibly lower), but a pullback would be an excellent buying opportunity as we expect the rally to continue into year-end. Our targets for the year-end rally are $469 (R2 Pivot Point), $480 (all-time high), or $484 (R3 Pivot Point).
Now let’s talk about the character of this market. It is a full-on Swing Trader’s Market (click on the link to learn more). This is the type of market where traders make the bulk of their profits and buy every dip. We can see from the chart below that the Nasdaq 1000 (QQQ) looks tired, but the Russell 2000 Growth (IWO) is just heating up. The number of Net New Highs is also increasing, telling us the market is delivering outsized returns in more and more stocks. Traders or stock-pickers could consider buying attractive non-mega-cap stocks at this point (always manage your own risk).
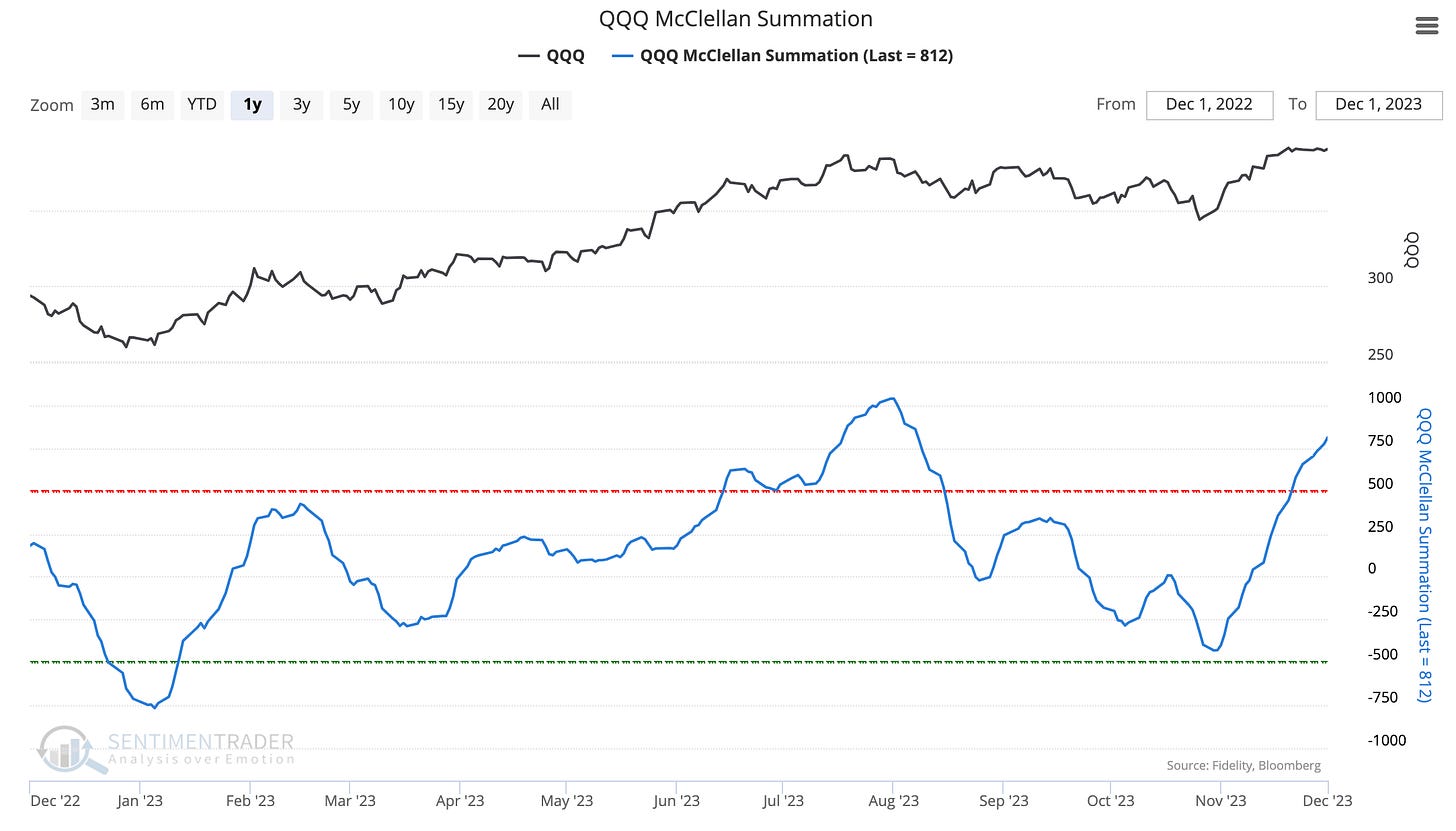
The following two charts show that the Nasdaq 100 (QQQ) Breadth is now overbought using the McClellan Summation indicator, however, the Russell 2000 (IWM) Breadth has a lot of room to run before getting into overbought territory. This is an edge for the small caps.
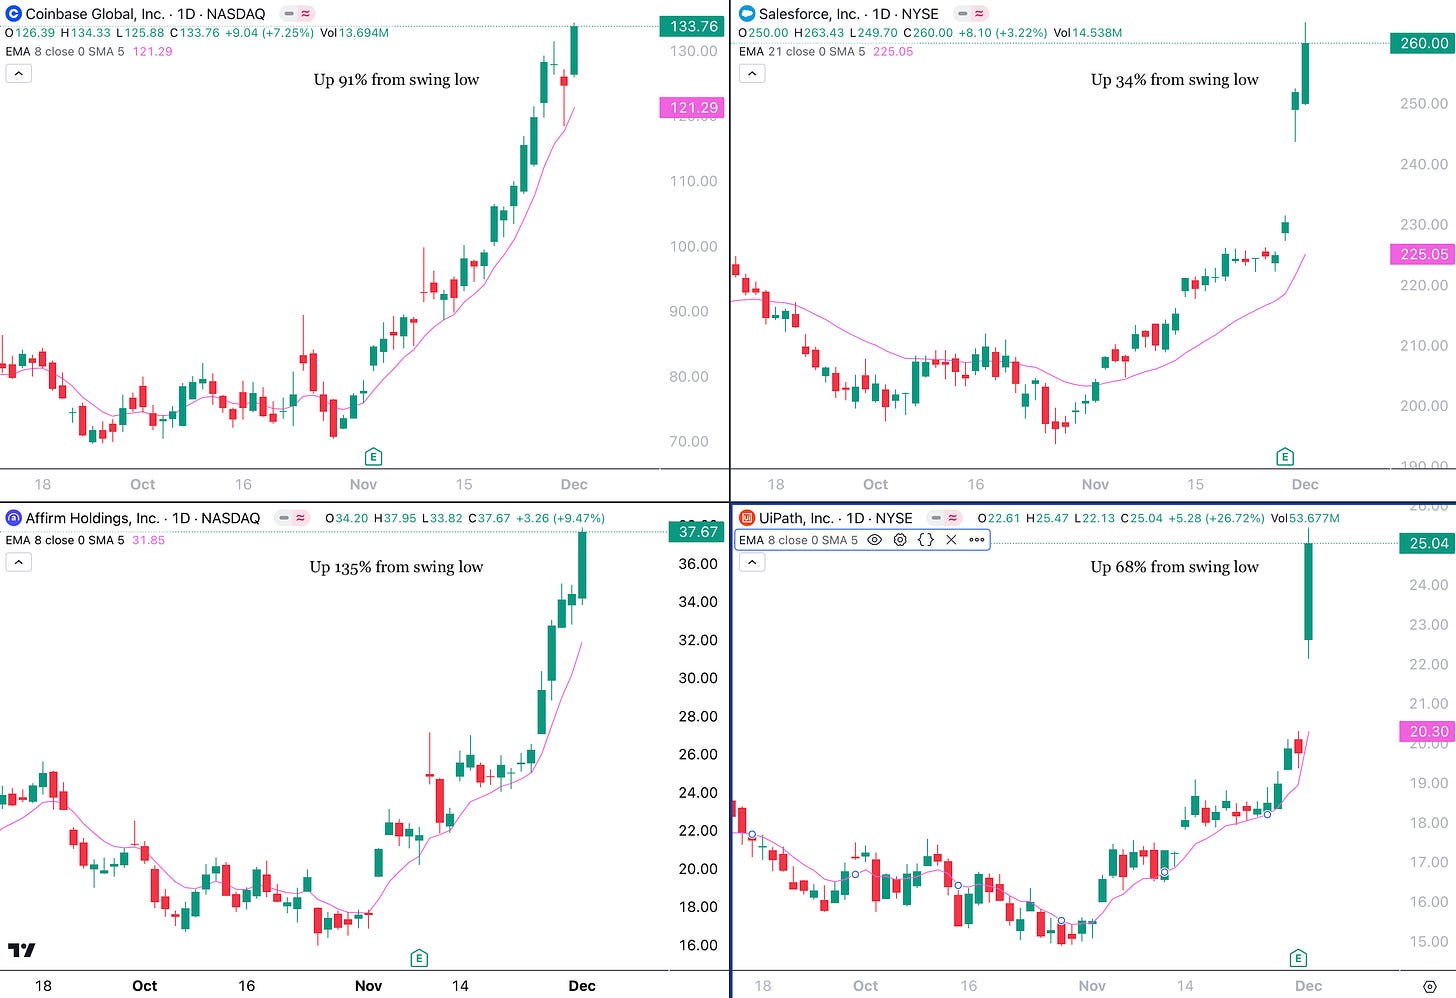
A Swing Trader’s Market brings very bullish price action to the best stocks. Looking at the chart below, from the recent lows, Coinbase was up 91%, Salesforce was up 34%, Affirm was up 135% and UiPath was up 68%. Of course, these stocks all had Fundamental Fuel:
Coinbase Fundamental Fuel - Growing TAM of cryptocurrency; the rising price of Bitcoin; new business opportunities as a crypto custodian for the up-and-coming Blackrock Crypto ETF; and reputation damage of one of their biggest competitors (Binance).
Salesforce Fundamental Fuel: Reported better-than-expected results on rising sales of its data cloud platform and its Einstein GPT artificial intelligence (AI) product; intention to go all-in on AI; and plans to repackage many popular products into a single cloud-based platform.
Affirm Fundamental Fuel: Added as first Buy Now Pay Later provider at checkout on Amazon; booming buy-now-pay-later merchandise volume growth; declining delinquencies; CEO reported Affirm is capturing market share in a growing TAM opportunity.
UiPath Fundamental Fuel: Reported rocketing sales and earnings growth; adoption of artificial intelligence into their Robotic Process Automation offerings.
Swing Trader’s Markets bring excellent opportunities, like these aforementioned stocks, for traders who know how to scan for them.
Rotations: Real Economy Stocks Are Now Beating Virtual Economy Stocks
Money is flowing into Real Economy stocks which have lagged this year and out of Virtual Economy stocks which have led this year. The caveat is software and AI stocks, which are still strong. Other than that, it seems like there is a profit-taking out of highly valued and extended Large-Cap Growth stocks and that money is being reinvested into areas that are not yet overvalued or extended.
The chart below shows many relative line charts and we can see that:
Large Value (IWD) is beating Large Growth (IWF)
Transports (IYT), which represents the Real Economy, is beating Semiconductors (SMH) which represents the tech economy
S&P 500 Equal Weight (RSP) is beating the S&P 500 Market Cap Weighted (SPY), representing a broadening out in breadth and participation, which is a dynamic that can extend the rally
Mid-Caps (MDY) are beating Large-Caps (SPY)
Small-Caps (IWM) are beating Large Caps (SPY)
Consumer Discretionary (XLY) edges out Consumer Staples (XLP), which is considered a “risk-on” sign
The performance table below shows that the leading asset classes and sectors such as KRE (regional banks), XLRE (real estate), PBW (clean energy), and IWN (small-cap value) outperformed the S&P 500 (SPY) by a huge margin last week. They also underperformed significantly in 2023. Meanwhile, the worst performers for the week such as XLC (communications), SMH (semiconductors), and QQQ (Nasdaq 100) all had 40%+ gains in 2023. It’s time to play catch-up for the laggards.
Last week we recommended IWS (Midcap Value), IWD (Large Value), XLB (Materials), and XLRE (Real Estate). Buying intraday dips in last week’s leaders included above could be a source of alpha, as this rotation is just beginning.
Conclusion: Focus on Buying the Dip Intelligently
Although there is typically some downside in early December, the bearish energy is going against strong Macro Fuel, Fundamental Fuel, and Trap Fuel in addition to broadening breadth. Shorting the market should be out of the question. Instead expect the rotation to continue. Use weakness to buy exposure in unextended real economy companies that are small, mid, or non-mega large-cap stocks. This is turning out to be quite the stock-picker’s market. Best of luck Making Money, as all signs point to a rally into the year-end. 2024 could be a different story altogether. Be sure to check out our Quarterly Cycle Forecasts which should be available on December 11th.
Disclaimer - All materials, information, and ideas from Cycles Edge are for educational purposes only and should not be considered Financial Advice. This blog may document actions done by the owners/writers of this blog, thus it should be assumed that positions are likely taken. If this is an issue, please discontinue reading. Cycles Edge takes no responsibility for possible losses, as markets can be volatile and unpredictable, leading to constantly changing opinions or forecasts.


