New Year, New Energy - Quick Note
In our 2024 Stock Market Outlook, we advised readers to expect 2024 to be a volatile year. On the first trading day of the year, we see a change in the complexion of the stock market.
Technical Damage on Day 1
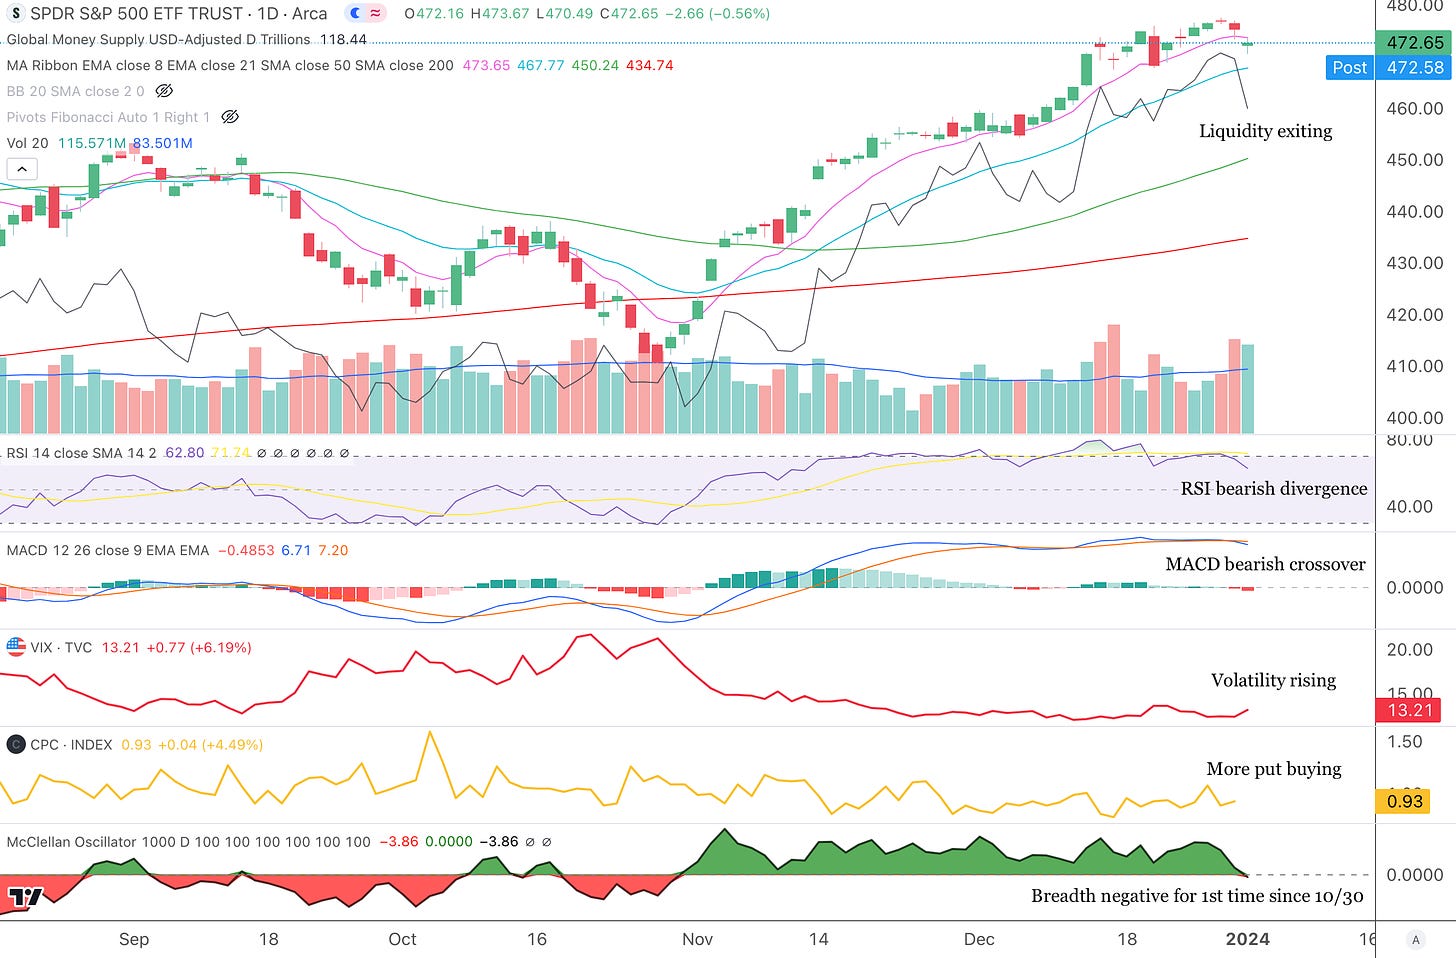
The S&P 500 closed below the 8 Exponential Moving Average (pink line), which is a show of weakness. This occurred as we see Global Liquidity declining (black line). The 21 EMA must hold at around $467 to keep this rally going. The Relative Strength Index (RSI) is showing bearish divergence, which is often the precursor to weaker price action. The MACD made a bearish crossover, a signal that negative momentum is picking up. Meanwhile, volatility (VIX) popped 6% today as more put buyers entered the market. Notice the Put/Call Ratio (CPC) made a higher low and is on an uptick. Finally, breadth is weakening as the McClellan Oscillator hit a negative reading for the first time since the rally began at the end of October. Something feels different.
The Swing Trader’s Market is in Danger
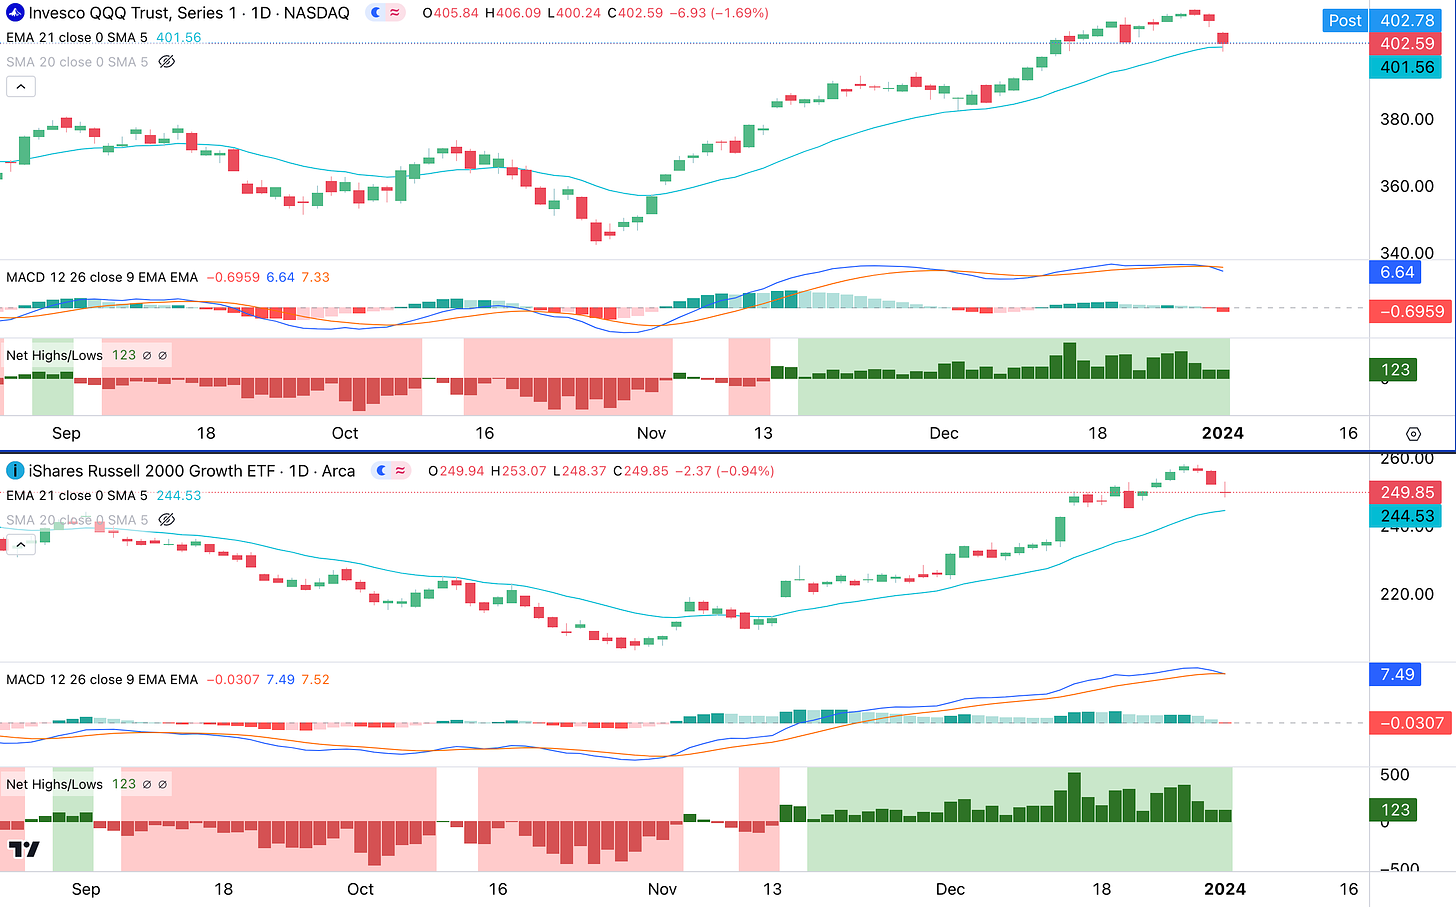
The Swing Trader’s Market, which is a favorable environment for individual stocks and oversized gains is now 2 months old, which is the time duration when many of these favorable environments tend to wrap up. The Nasdaq 100 (QQQ) fell to the 21 EMA and appears to be holding it for now. A close below this would signal to us that positive times for large-cap growth stocks are over for now. The Russell 2000 Growth (IWO) is still above the 21 EMA but is also losing momentum, as evidenced by the MACD which made a bearish crossover today. Finally, Net New Highs is beginning to dwindle, albeit still positive. Should this indicator show Net New Lows, it’s fair to assume that the Swing Trader’s Market is over.
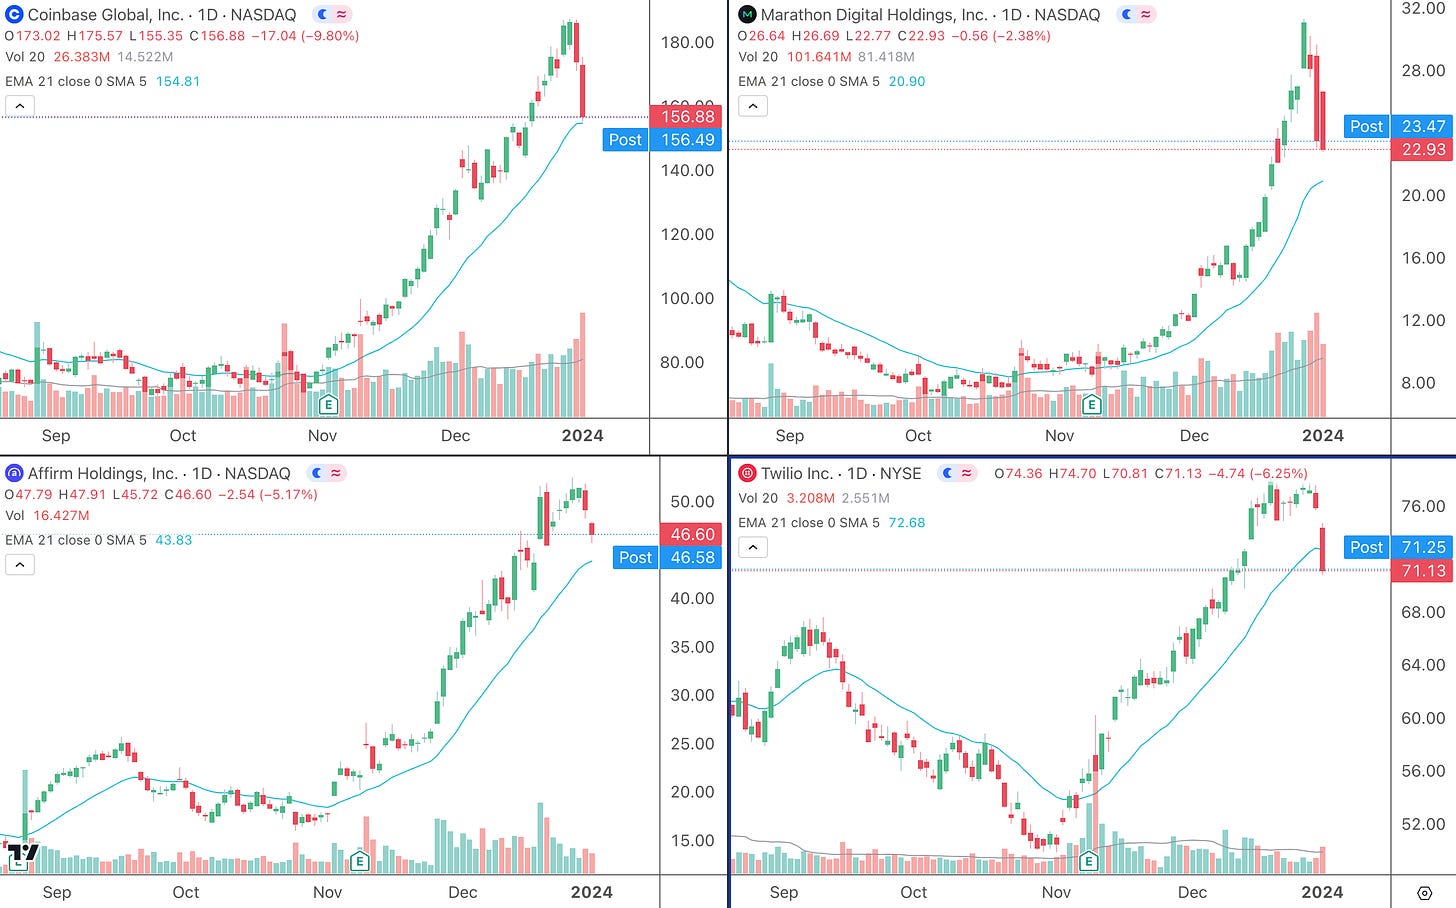
Many of the leader stocks are falling hard. We can see from the chart below that COIN, MARA, and AFRM all fell hard but are still above the 21 EMA. TWLO, like other leading stocks, fell below the 21 EMA signaling the end of its uptrend. Within a few more days it should be clear if this Swing Trader’s Market continues or ends.
When it Gets One-Sided…
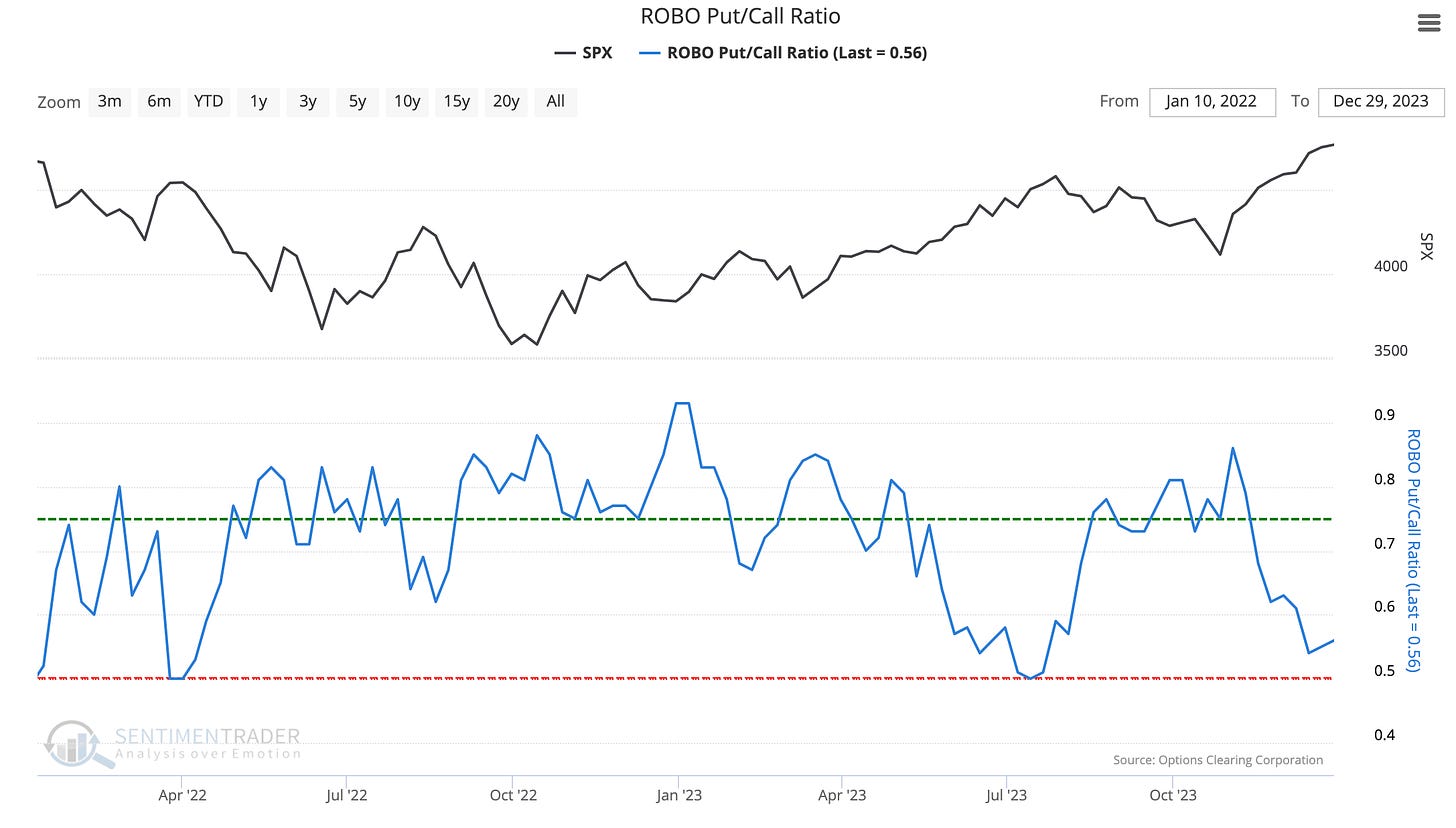
When everyone expects one thing, the market often gives the opposite. Sentiment got too bullish over the past two months so, like clockwork, the market makers decided to go bull hunting. In our 2024 Stock Market Outlook we provided a warning regarding the recent bullish consensus. You could see from the Retail Put/Call Ratio below that retail washed out their puts and got heavily long (bought call options) on the market. With that action, the market went the other way.
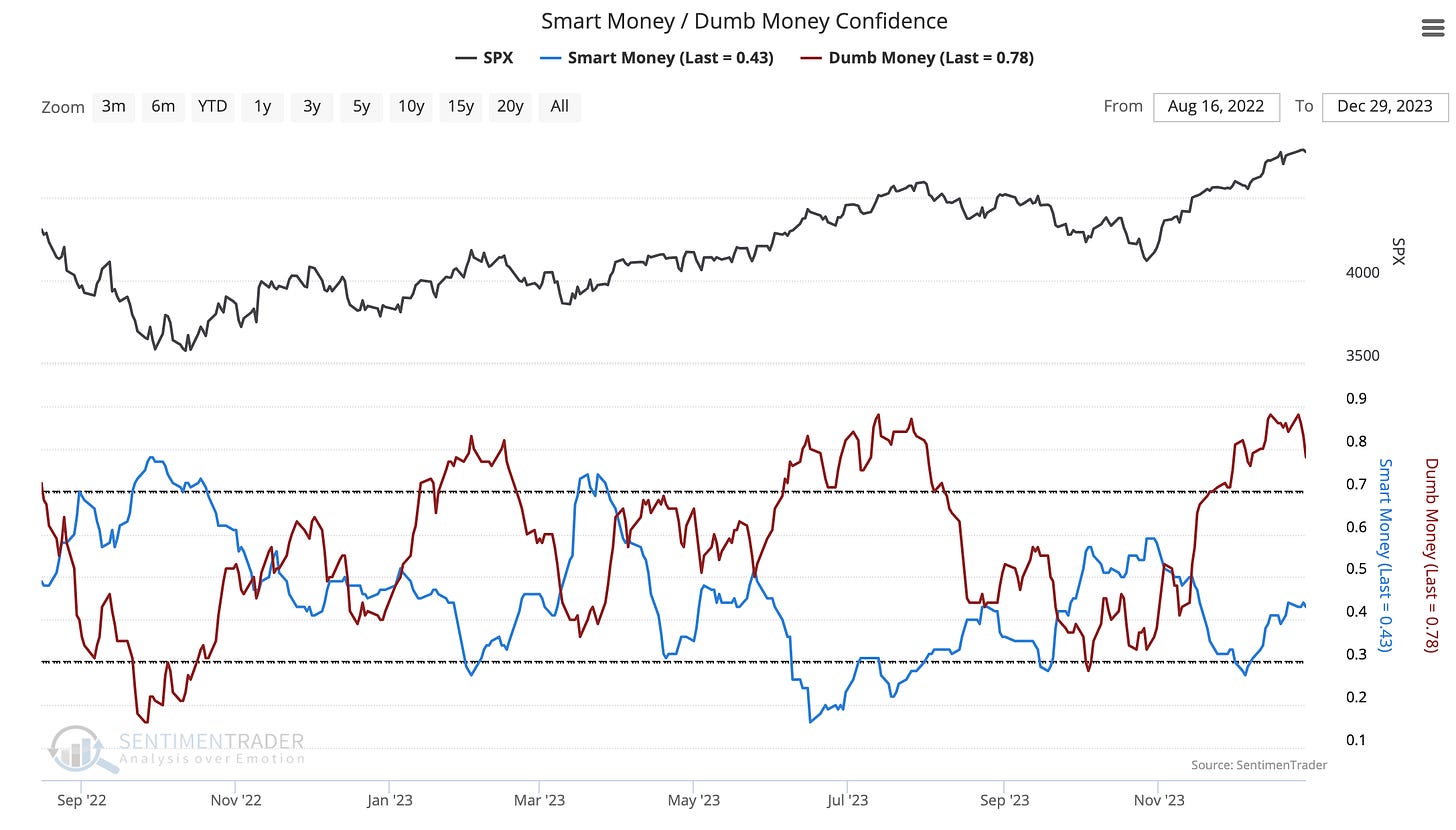
Similarly, Dumb Money got too confident…
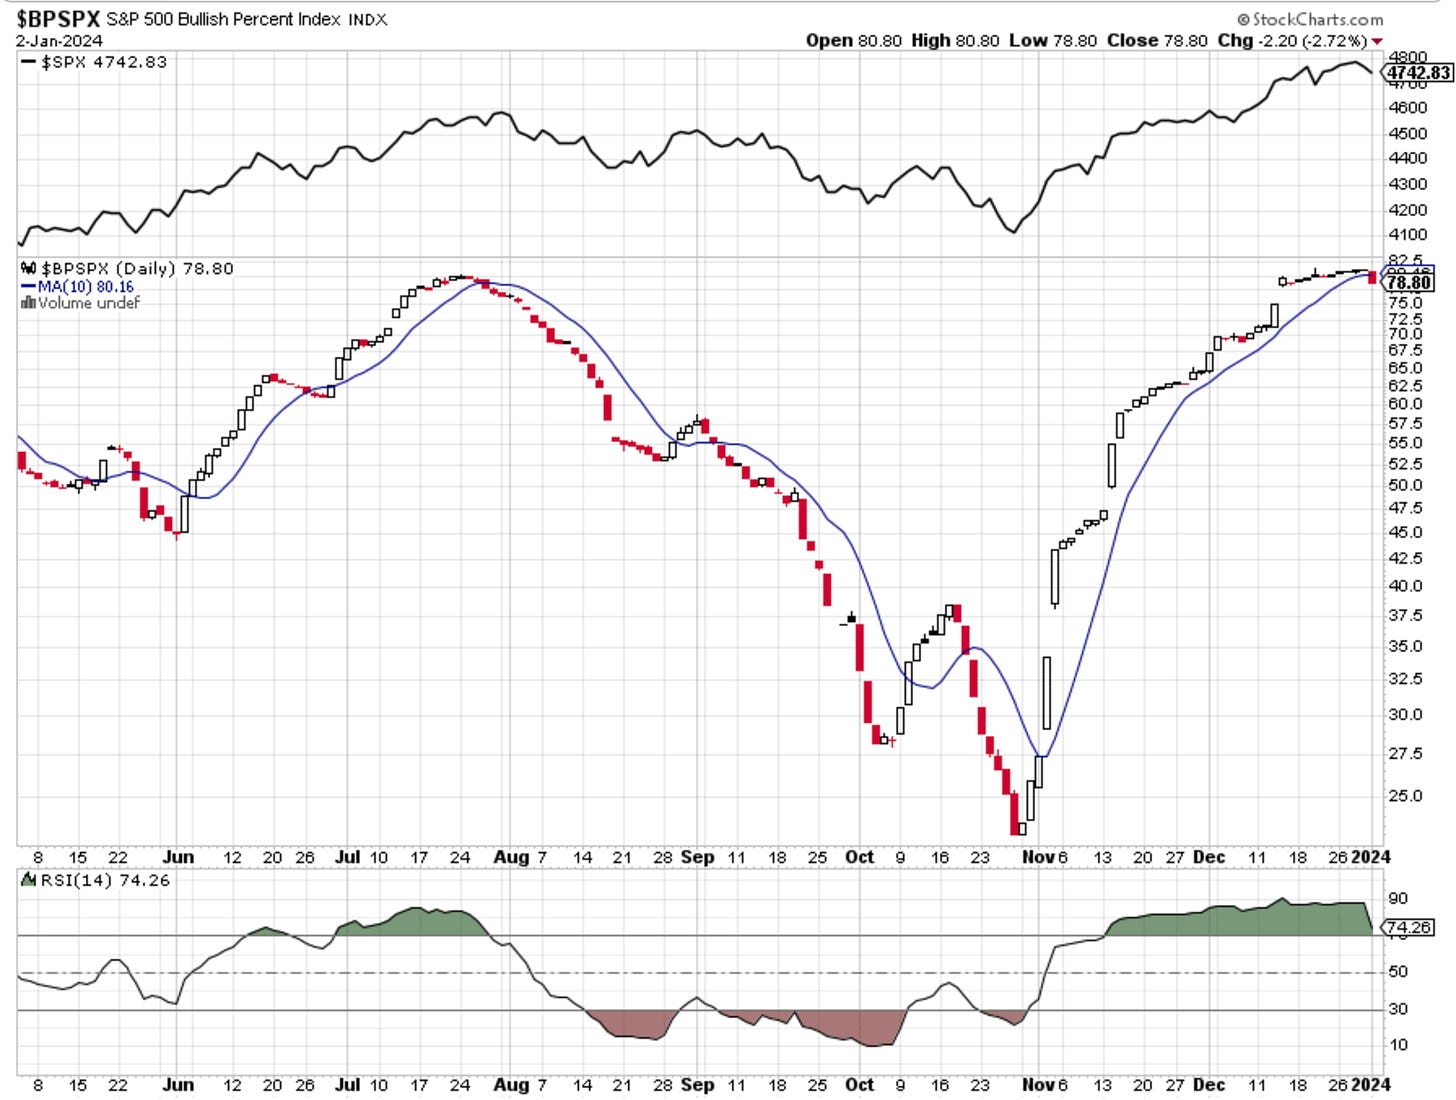
Finally, we are getting the signal that it is the bears’ turn to control the playing field. When the Bullish Percent of S&P 500 Stocks (a breadth indicator that works like an oscillator) gets past the 70 mark and drops below the 10-day Simple Moving Average (blue line), it is a pretty reliable sign of a bearish reversal. That signal occurred today.
A Defensive Rotation
Over the past week, we noticed profit-taking coming into the market. Offensive sectors like Technology, Communication Services, and Consumer Cyclicals were hit the hardest. However, money is rotating into defensive sectors such as Healthcare, Consumer Staples, and Utilities. This provides support to the thesis that the market is weakening. It also provides opportunities in these defensive sectors. We’ll provide setups to our paid subscribers as they arise.
Cycles for January
For our Paid Subscribers, we’ll share our Cycle Forecast for the S&P 500 in January.1
If you would like to purchase our Cycle Forecasts for the First Quarter, click here.


