In this article, we’ll go over Copper, Copper Miners, Oil, and spot Natural Gas. Copper and Natural Gas have had a sizeable move up, whereas, Oil has seen a big move down. Let’s look at where the Money Making opportunities lie and how to play each of these 3 assets.
Copper Technical Analysis
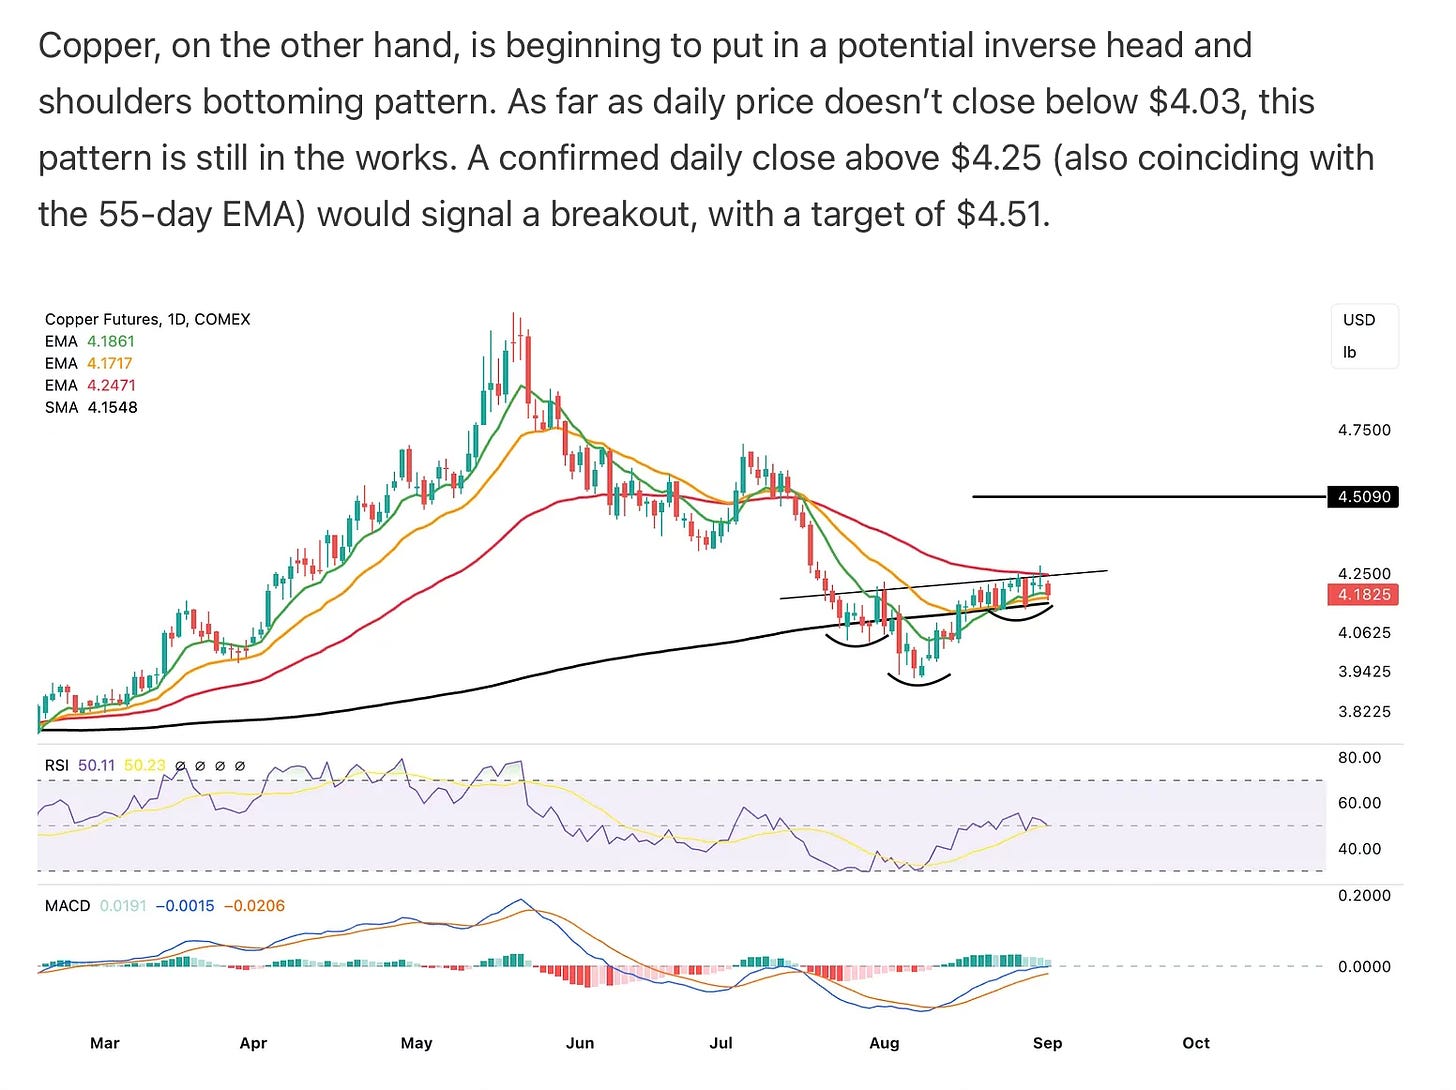
In our last Copper update (found here), we had outlined the inverse head and shoulders that was forming on Copper. Below is a screenshot of exactly what we said:
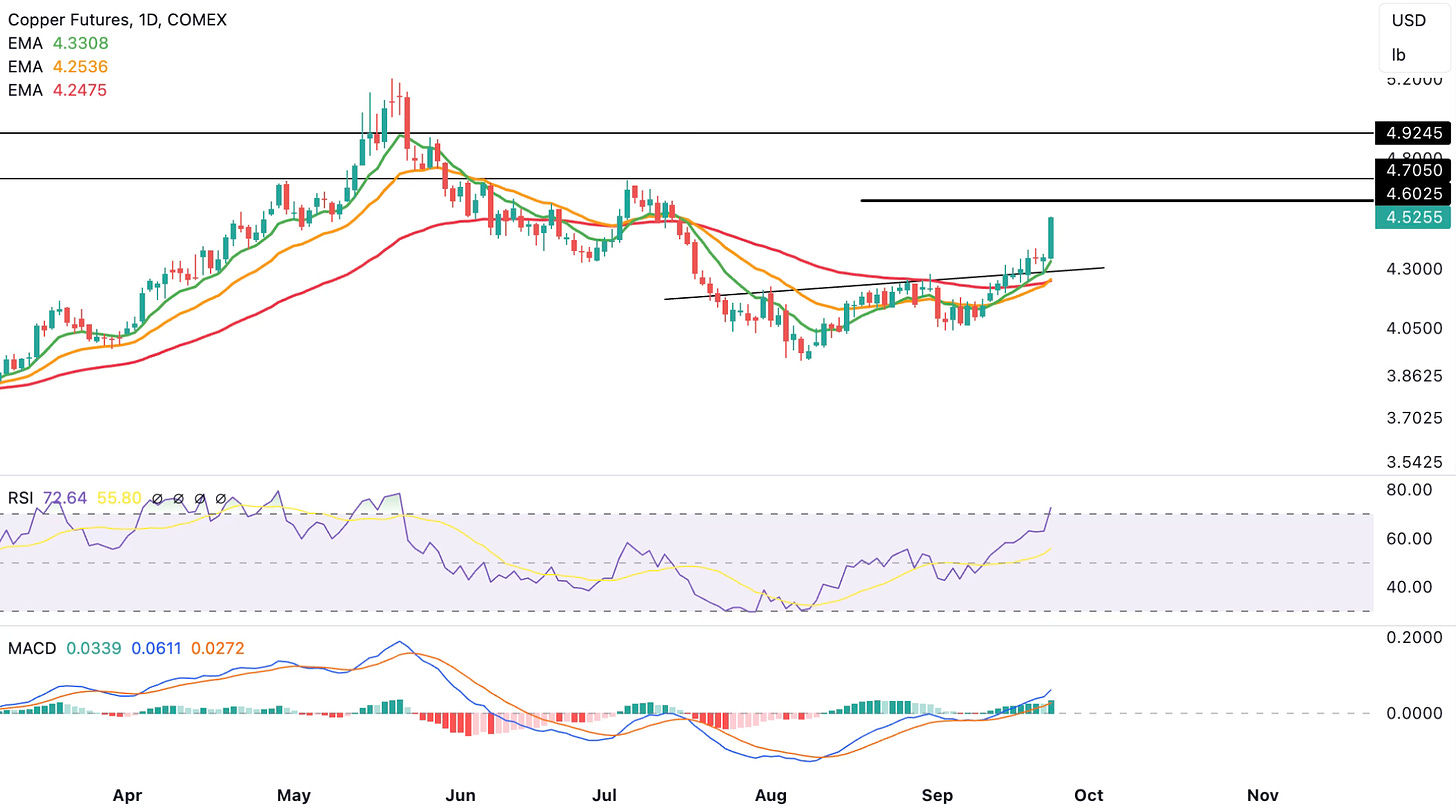
Today, Copper has just hit the $4.50 with a big green candle! One thing to note is that we’re fixing the inverse head and shoulders from $4.50 to $4.60 instead, due to the exact level from where price broke above the inverse head and shoulders’ upward sloping neckline.
The region between $4.60 (inverse head and shoulders pattern target) and $4.71 (0.618 Fibonacci retracement from May 2024 high to August 2024 low) is a resistance zone. It’s very likely for Copper to retrace from this region, which could potentially provide a buying opportunity. If/when that happens, we’ll be sure to highlight it.
However, a clean break above $4.71 right now would open up the $4.92 level (not our base case for now). Therefore, any member who took the Copper Trade when we highlighted it back at $4.18 level should consider de-risking between $4.60 and $4.71, but can keep a small position open for further upside potential.
Oil Technical Analysis
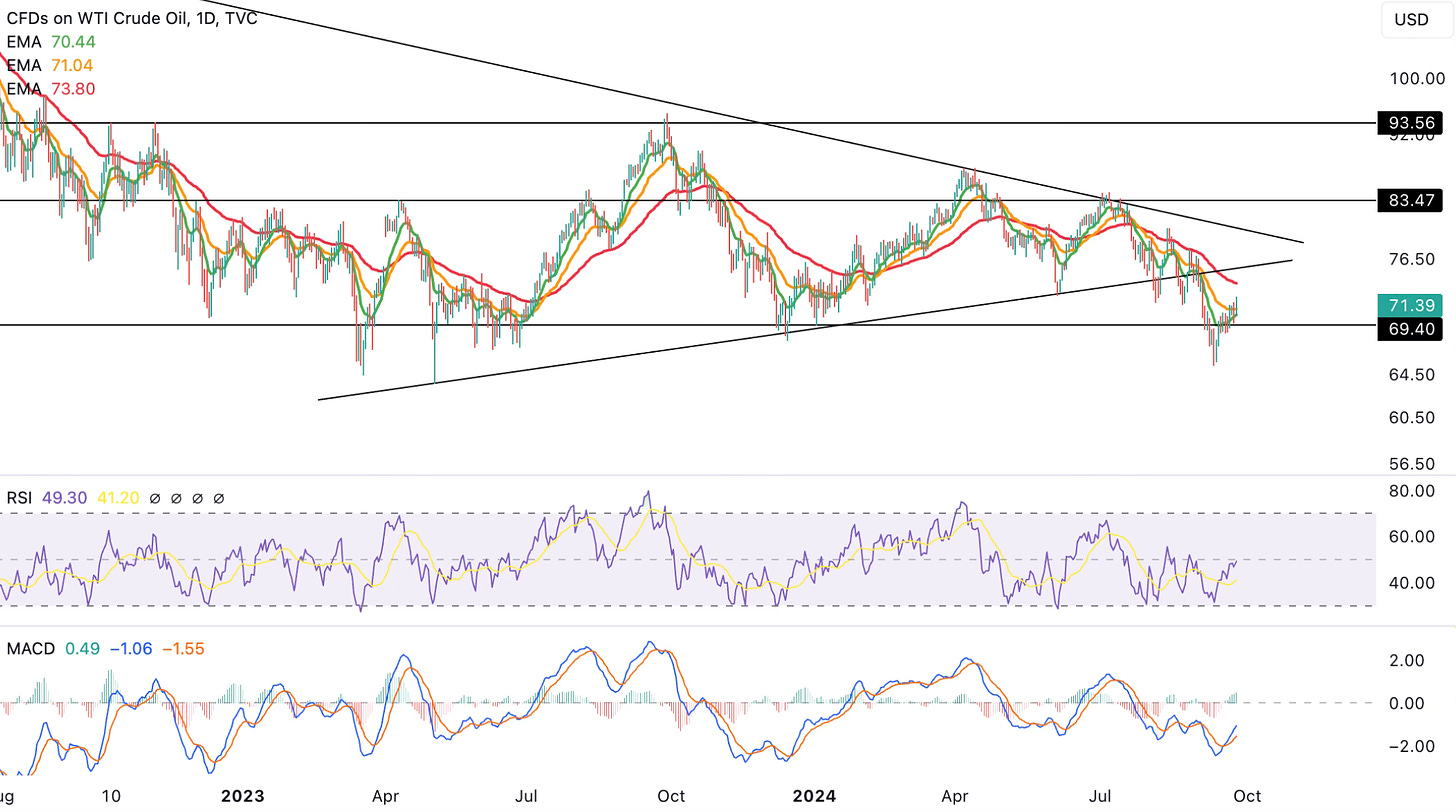
We’ve been sitting on the sidelines for Oil because it hasn’t given us an attractive long/short setup. However, Oil has seen quite a bit of weakness in the past few weeks that led price to break below the uptrend line and also temporarily break below the $69.40 support level.
Right now, the smart move here would be to continue staying on the sidelines and waiting for one of 2 scenarios to occur before executing a long or short trade.
Either Oil reclaims the uptrend line by closing at or above $76 (long trigger) or Oil rejects at the uptrend line and starts rolling over (short trigger). It’s best to let the price action lead us, instead of acting on a particular bias here.
Natural Gas Technical Analysis
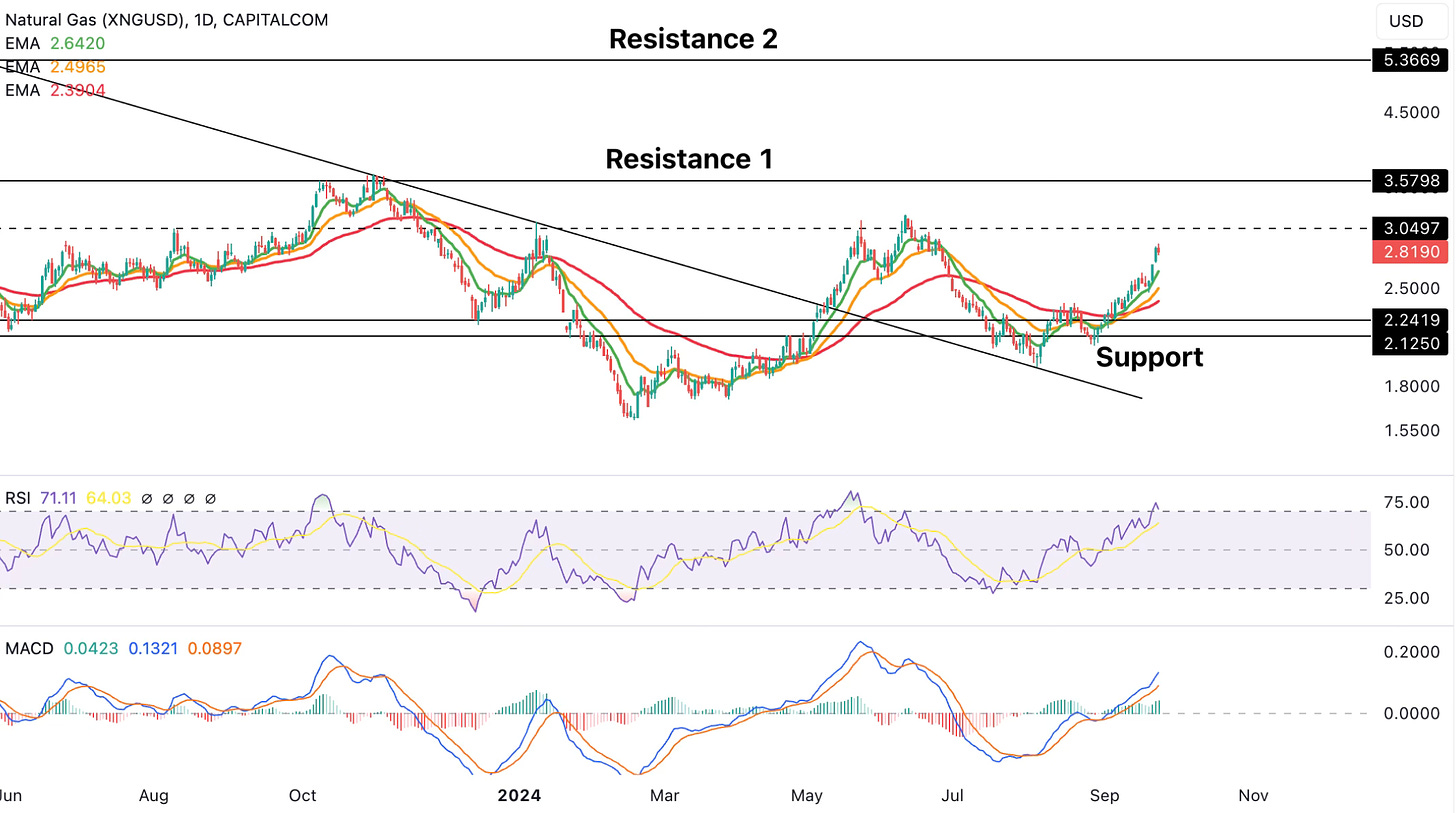
Natural Gas has been another profitable trade for our members. We’ve been bullish on Natural Gas since $1.90 (found here) and also highlighted another opportunity around $2.125 (found here). Both of these positions are now in significant profit. Congratulations to all our members who took this Trade!
Our initial upside target still remains at $3.05, but it might make sense to not get too picky with the exact price and start de-risking from $3 itself. One can consider holding part of the position though because if Natural Gas breaks above $3.05 minor resistance, then $3.58 resistance is at play.
However, either from $3.05 or from $3.58, a pullback at the very least is highly likely. We’ll re-consider adding Natural Gas during that retracement (if the setup is there), but for now don’t FOMO in and those who are already in this Trade, please get ready to de-risk soon.
In the Premium Section, we’ll first cover the Copper/Gold ratio. Then we’ll analyze Copper Miners ($COPX). Lastly, we’ll take a look at our proprietary Cycle Forecasts for Copper, Oil, and Natural Gas. Combining the technicals with Cycles will help our members be on the right side of each of these 3 assets to capitalize on potential gains. Let’s dive in!
Note: We have finalized our Q4 2024 Cycle Forecasts and have just sent that out to our Founding Members. In case you didn’t receive the Forecasts, please reach out via the Discord Server. We’ll have the Forecasts available for sale on our website later this week. If you want early access to the Q4 2024 Cycle Forecasts and exclusive access to the Annual Cycle Forecasts consider joining the Founding Member tier.
Find our membership cost/benefits below. If you’re serious about Making Money (our primary goal at Cycles Edge), then the Premium Sections are key for you!
Copper/Gold Ratio


