Just 1 day left for the US Presidential elections. Let’s take a look at Oil, Natural Gas and Copper to see what to expect for the month of November.
Oil Technicals
After breaking below the upward sloping support, Oil has just been chopping around above the $67.3 support level.
A bullish and bearish case can be made for Oil, which is why we continue to remain neutral on it, since neither side holds an attractive risk-reward (unlike another Commodity like Copper that we’ll cover later on in this article).
Geopolitical Risks
One potential upside catalyst for Oil is the ongoing Geopolitical tensions in the Middle East – a key supplier of Oil.
But for now, that’s not yet a market concern based on the Geopolitical Risk (GPR) Index, which typically spikes around concerning Geopolitical tensions.
Currently, the GPR index is quite low, indicating that the conflict in Middle East has still not escalated to a potential market shock level.
Oil Positioning
Another reason we’ve decided to remain neutral on Oil is because of the current pricing structure that’s indicative of the risk-reward not being present for either side.
The term structure of crude oil futures shows the relationship of the near-term futures contract to a further-out contract.
If it is above 1.0, then the near-term contract is priced higher than the further-out contract, called backwardation. This can be an attractive short in the works, but the risk-reward only gets attractive above a reading of 1.05 at least.
If below 1.0, then the market is in contango. When it goes into severe contango, that is a sign of stress in the market and has typically only occurred when the crude oil was forming a long-term bottom i.e., an attractive long.
For now, the term structure is at 1.02, not showing a clear bias in either direction.
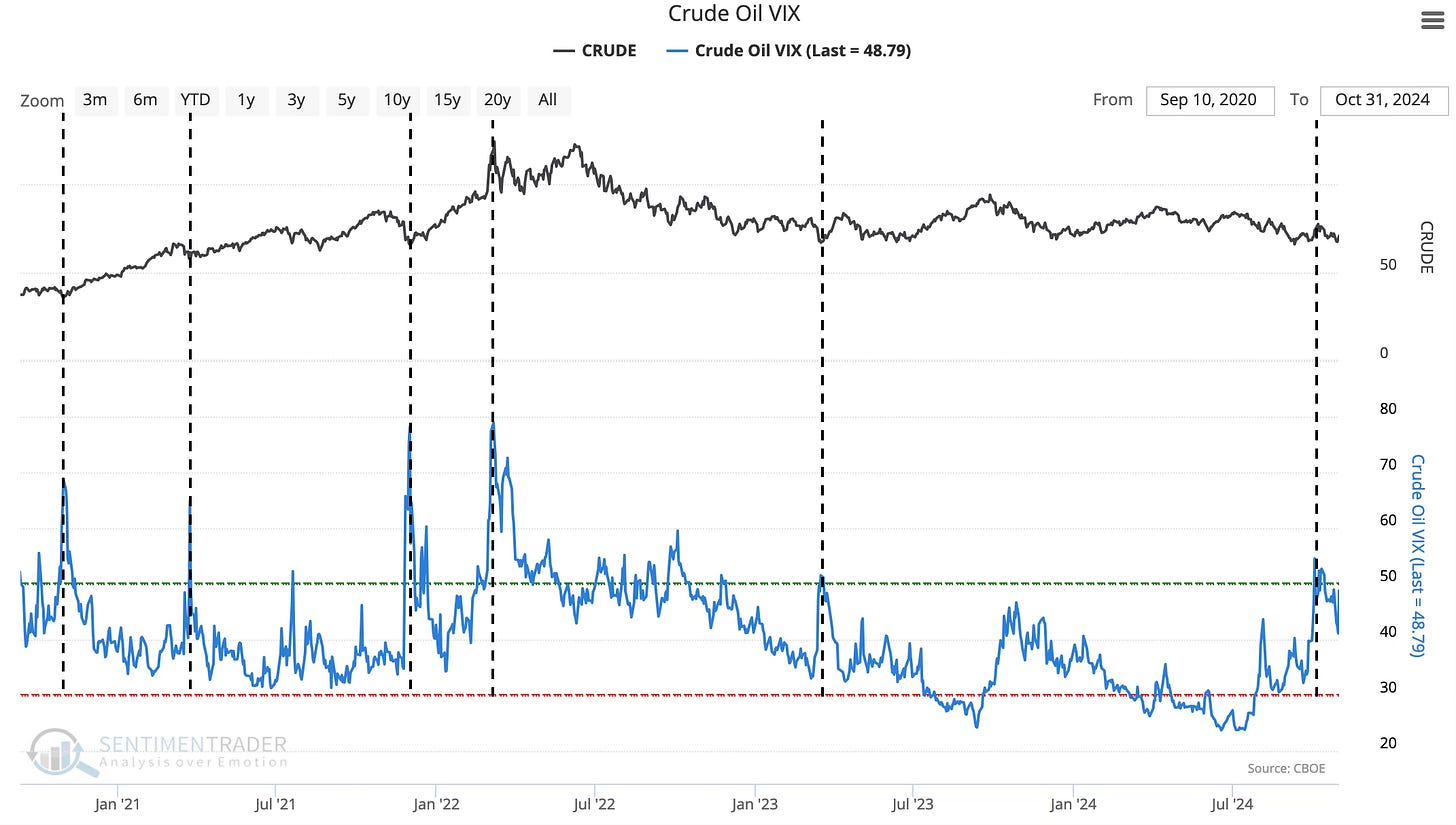
Even Oil’s Volatility agrees with a neutral view for now.
Like the VIX that most people are familiar with, which tracks traders' expectations of future volatility in the stock market according to option pricing models, the next chart tracks oil volatility expectations using the USO exchange-traded fund.
In commodity markets though, there is no clear correlation between price and volatility like there is in stocks. Sometimes with commodity funds we see volatility explode higher on the upside, not just the downside.
So, an extremely high level of volatility can be a positive sign (if the commodity just sold off hard) or a negative sign (if the commodity just rallied hard).
Right now, even though Oil’s VIX is rising, we don’t have a spike yet. We’re closely watching out for the next Oil VIX spike and Oil’s price direction during that spike to help dictate our next move.
Natural Gas Technicals
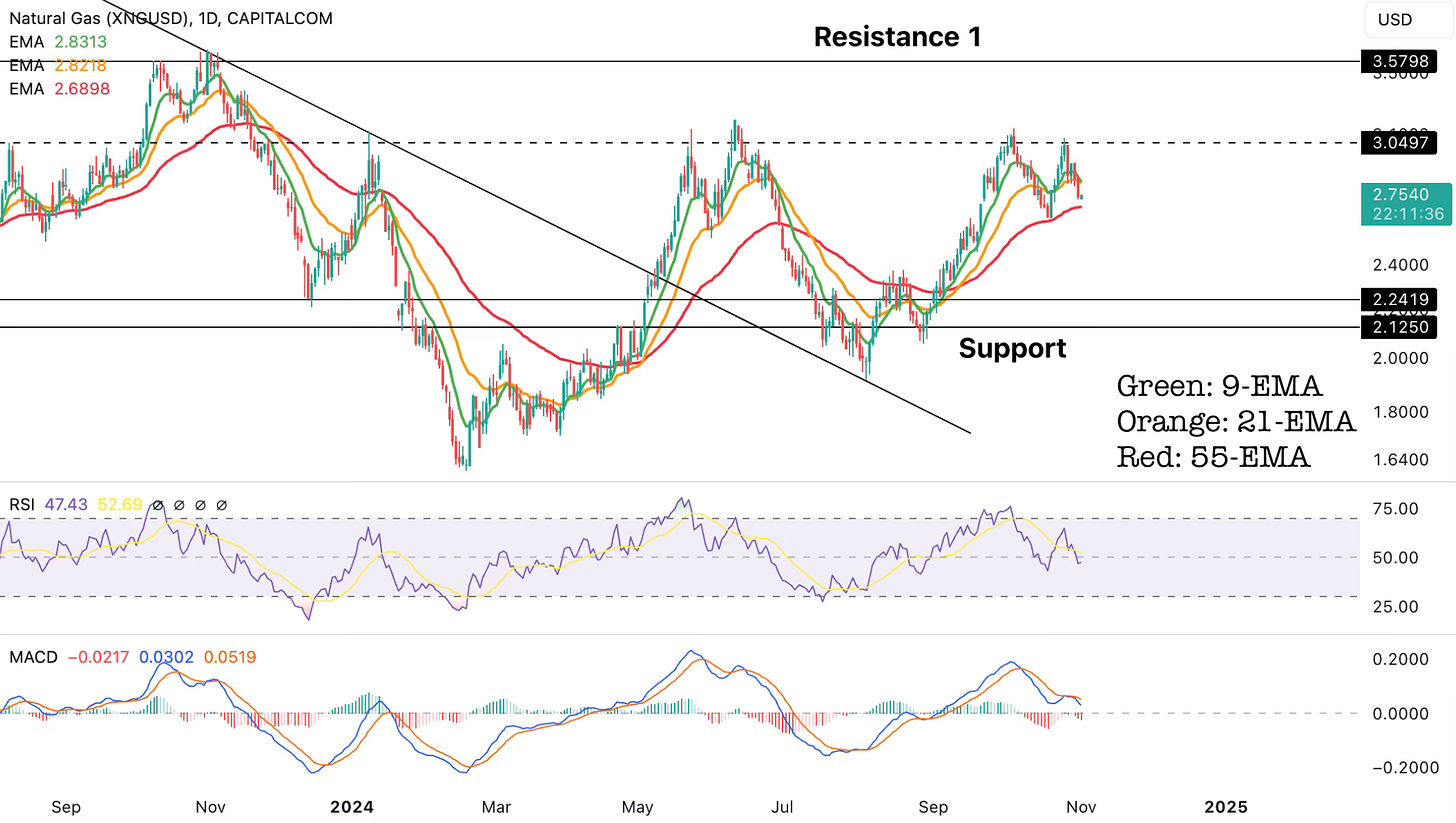
Natural Gas has been a profitable trade for our members. We’ve been bullish on Natural Gas since $1.90 (found here) and also highlighted another opportunity around $2.125 (found here). Our initial upside target was $3.05 (found here) and that has officially been hitting, giving our members a solid 60.5% since our first call.
Our next move will depend on whether price breaks above $3.05 resistance level on a daily closing basis or breaks below $2.69 support (daily 55-EMA).
If price breaks above $3.05 on a daily closing basis, then that triggers an inverse head and shoulders bullish pattern with a pattern price target of around $4.8.
If price breaks below $2.69 on a daily closing basis, then that triggers a breakdown with a lower high and lower low + bearish MACD rejection + break below all key MA’s. In such a scenario, we’ll watch how price reacts around the $2.42 level and if that doesn’t hold, then the $2.13 - $2.24 region.
Our proprietary Cycle Forecasts (covered later) should help us decide which one of the 2 outcome is more likely.
Copper Technicals
Even though we’re neutral on Oil and closely watching 2 levels for an upside or downside trigger on Natural Gas, we find Copper’s current setup quite attractive.
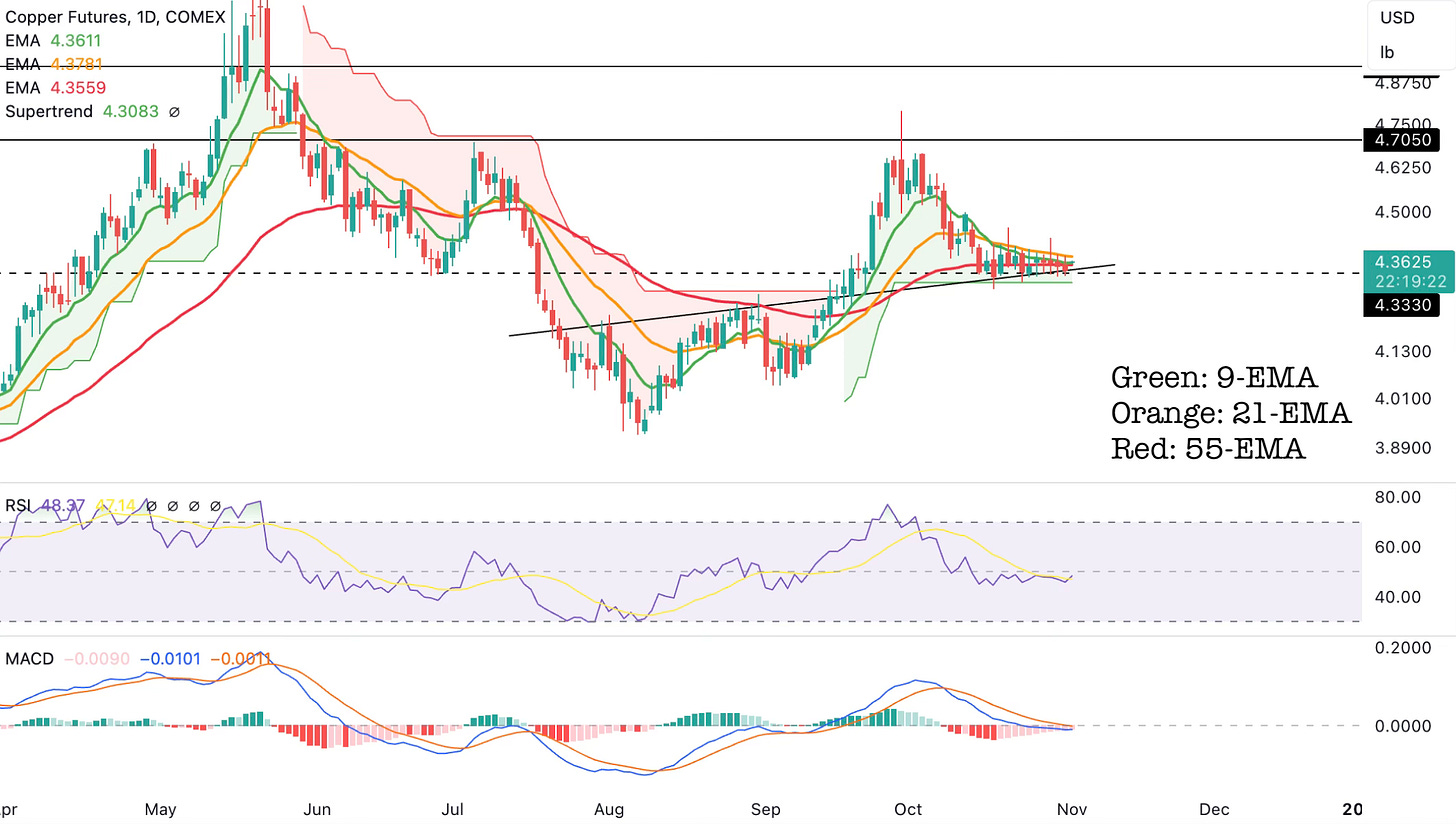
Our members already caught the initial inverse head and shoulders’ basing pattern breakout from $4.18 all the way to $4.71 (found here). Moreover, we also timed the pullback accurately (found here). Now, it might be time to prepare for the next move up.
Right now, Copper is:
1) Retesting previous resistance (inverse head and shoulders’ neckline) as support
2) The $4.33 horizontal support level
3) Bullish Supertrend support level
4) RSI has fully reset
5) MACD is about to flip bullish
This is a clear bullish setup. The next level from here should be back to the $4.71 resistance level as far as the $4.29 level holds on a daily closing basis.
Things can get even more interesting if $4.71 resistance level is broken because that would trigger a bigger inverse head and shoulders’ pattern breakout with a pattern target of $5.55.
Next up, we’ll look at our proprietary Cycle Forecasts for Oil, Natural Gas, and Copper to get a Timing Edge. We’ll also check on the Seasonality aspect of Oil and Copper to be on the right side of the market. Then, we’ll analyze Copper Miners ($COPX) to view the opportunity there. Lastly, we’ll highlight a very attractive potential Money Making setup in another economy-related Commodity.
Find our membership cost/benefits below. If you’re serious about Making Money (our primary goal at Cycles Edge), then the Premium Sections are key for you!


